What "Voting Integrity" Must Have Seen
But didn't show us when graphing their data

This installment, I’m actually going to try to graph the win ratio vs. margin data the way “Voting Integrity” did, for two reasons:
To see if I see a similar set of outliers
To highlight data difficulties that ‘Voting Integrity’ chose to cover up
I’m going to make one minor change to the graphing to get it to fit into a single quadrant - I’m going to chart the winning ratio of a vote update against the winning margin. And initially, I’m not going to remove any “updates” from “Voting Integrity’s” dataset.

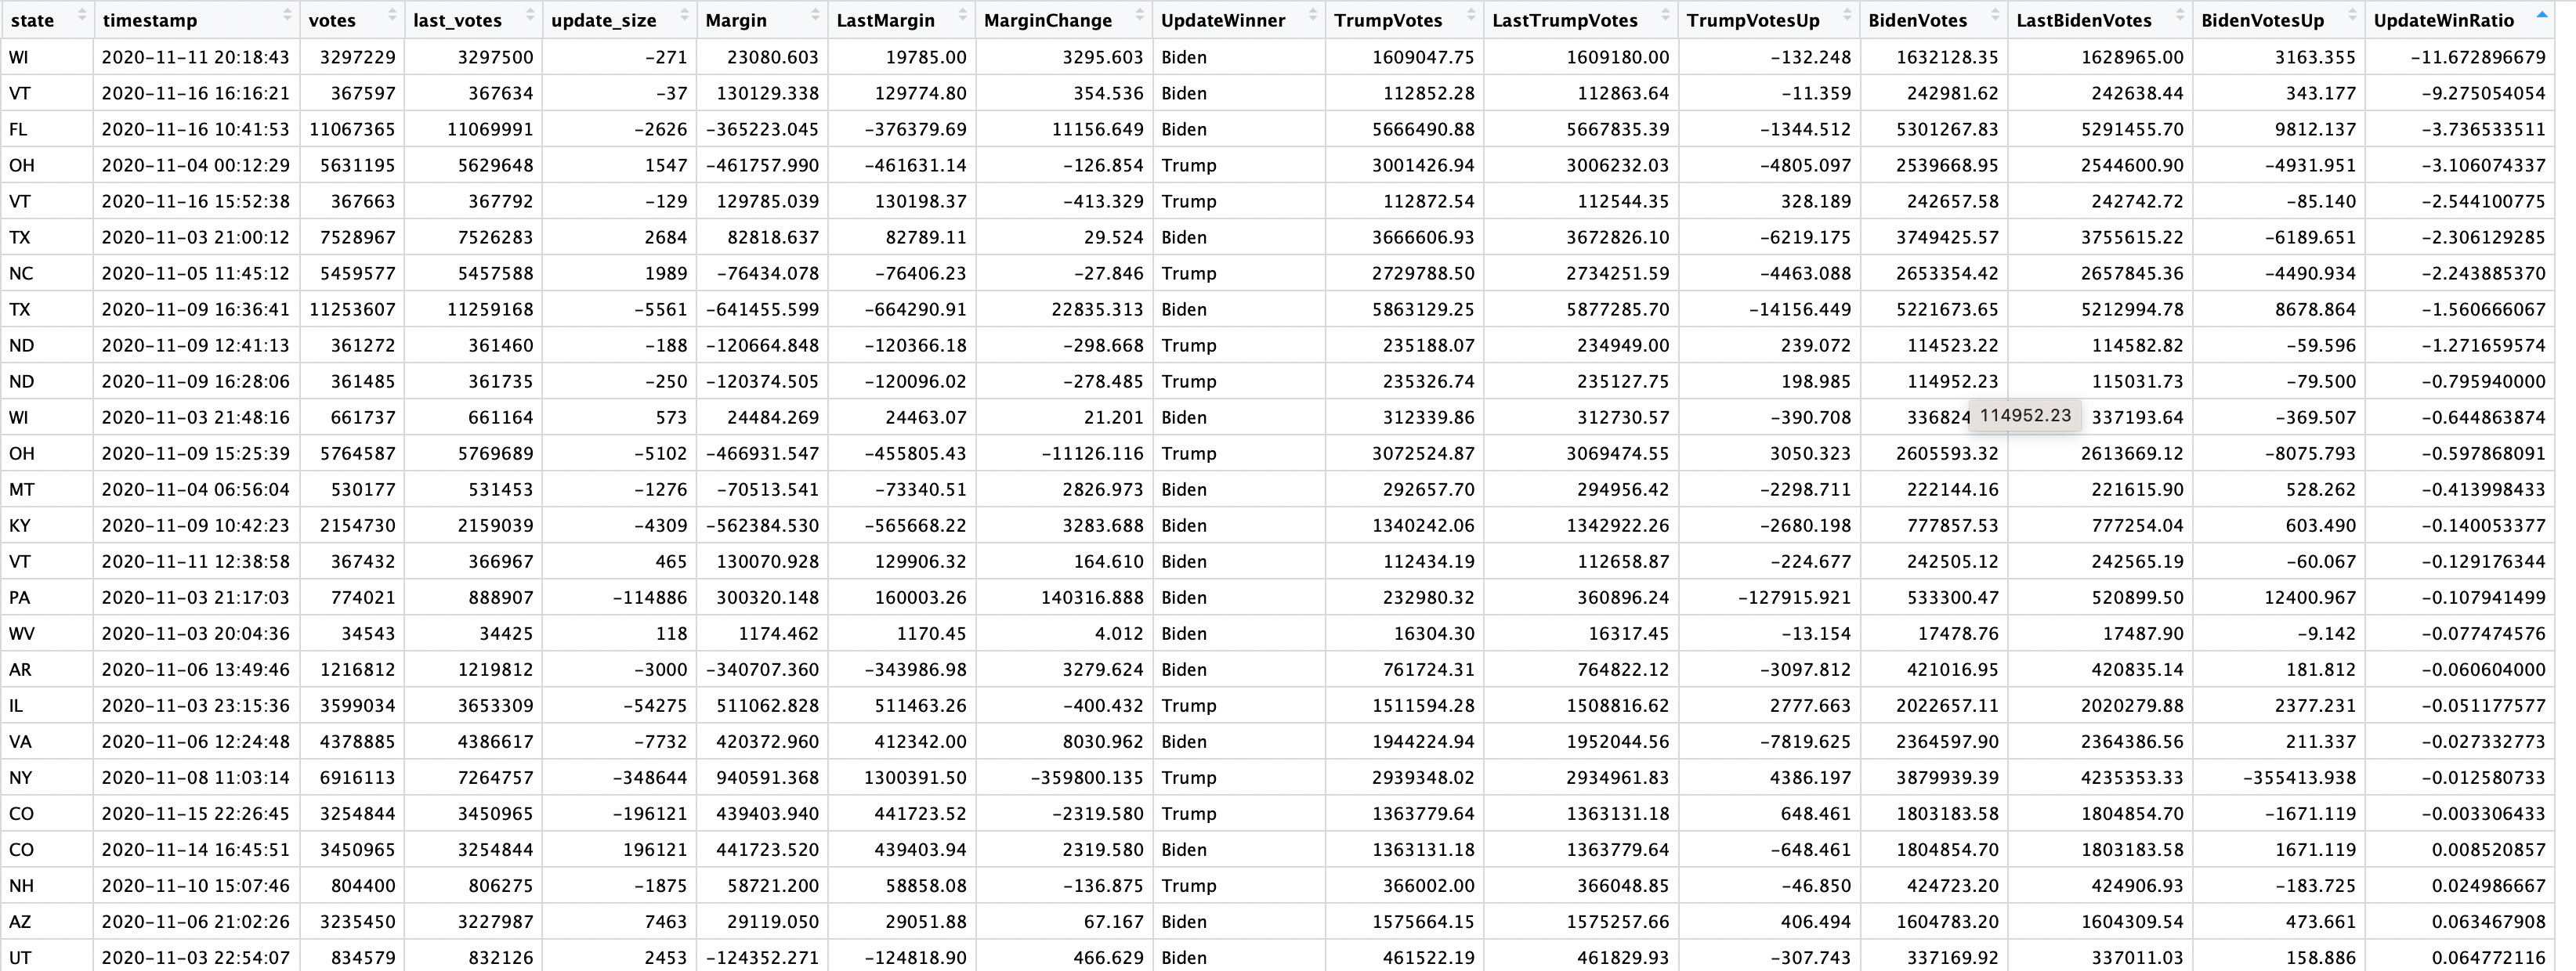
Here’s the first graph that “Voting Integrity” would have seen. There’s something horribly wrong - we have many vote updates with win ratios that are greater than 1, where a candidate won by more votes than the total vote update for that batch. And even uglier, some of the ratios are even infinite. How does this happen ? Here’s a view into the vote updates that have the largest win ratios.

It’s very clear that something fishy is going on because “Voter Integrity’s” data has updates where the change in margin between candidates is greater than the total vote update size. That essentially means people are shifting votes away from one candidate to the other candidate in the vote update. And in some of these cases the update size is zero, which makes the update win ratio infinite.
And if I look in the negative direction, I also see a problem, but one that isn’t quite as bad. We have situations where the vote update was negative and the winning candidate picked up more votes in that update than the net vote change from the update. Once again, votes were shuffled between candidates during the update, as well as the total being changed, with votes removed.
That begs a couple of tough questions. How do we detect these problems ? Can we remove them ? If we remove them do we have to change the other vote updates since this data is all chained - all the delta values for each vote update (update_size, UpdateMargin, BidenVotesUp, TrumpVotesUp, and UpdateWinRation) are calculated based on the difference in cumulative vote from the previous cumulative total. Removing the “anomalous” updates would result in changes to the next update and would percolate through all subsequent updates. And then there’s the obvious question - is what’s happening in these vote updates even legitimate ?
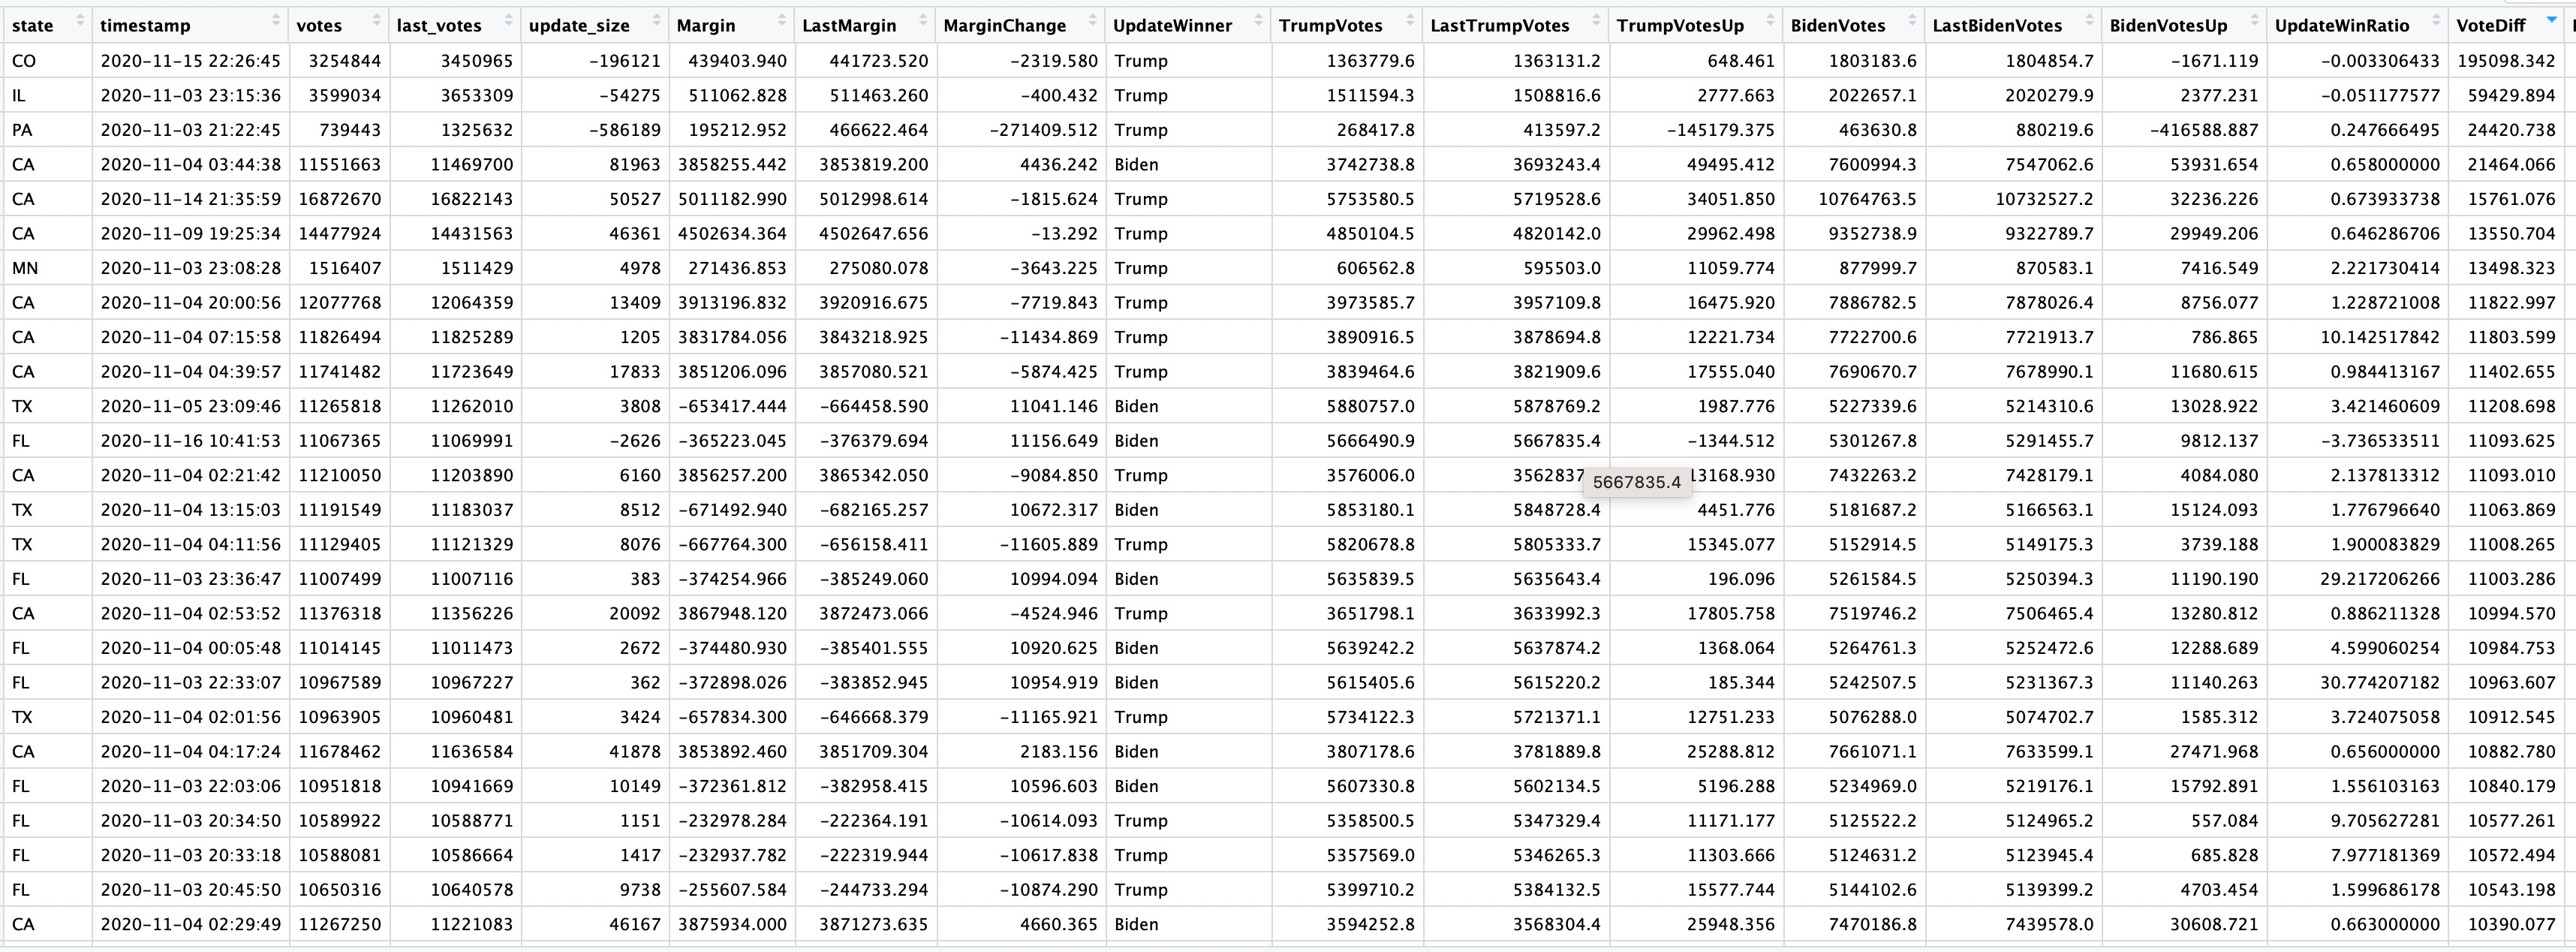
Just to try to understand what’s going on her, I’m going compute the difference between cumulative votes picked up by both candidates in an update vs. the total number votes in that update. If there is a difference, something wacky is going on - votes are either being created or removed in that update. I’m going to call updates where these numbers differ by more than a third party candidate could have picked up, “unbalanced updates”. Here’s a list of the largest unbalanced updates where the update size was far larger than the change in Biden and Trump votes. The largest of these unbalanced updates on the negative side in CO, increased the vote count by over 195,000 votes more than the votes given to Trump or Biden.

Just to convince myself that this data is real, I’m going back to that sequence of updates in CO, in magenta below. Sure enough, we actually have two back to back “unbalanced updates” on two different days, Nov 14th and 15th of around 196K votes. Looks like the largest CO issue is a situation where incorrect data was added, then deleted resulting in two very anomalous updates !

When I look at the opposite side of the ledger, unbalanced vote updates where the candidates are given a far larger number of votes than the change in the vote total, CO pops to the top of the list, but not unexpectedly. We see the offsetting vote update at the top. But that relationship does not continue. The next states on the largest and smallest (most negative) list are different.
Instead of trying to examine a long list, I’m going to try to a quick feel for how much of “Voting Integrity’s” vote updates are unbalanced. My first histogram includes the CO points, single points that are close to the outside on both side of this graph.

If I reduce the unbalanced # of votes range to -5K to +5K, that removes 326 outliers outside of that. I’m guessing that moss of these are actually close to balanced. The key to the negative side is what I would expect given that my VoteDiff calculation does not include votes that go to other candidates (total vote in update is larger than the sum for Trump and Biden). So we have about 300 ugly unbalanced updates in 9600 total updates or about 3.1%

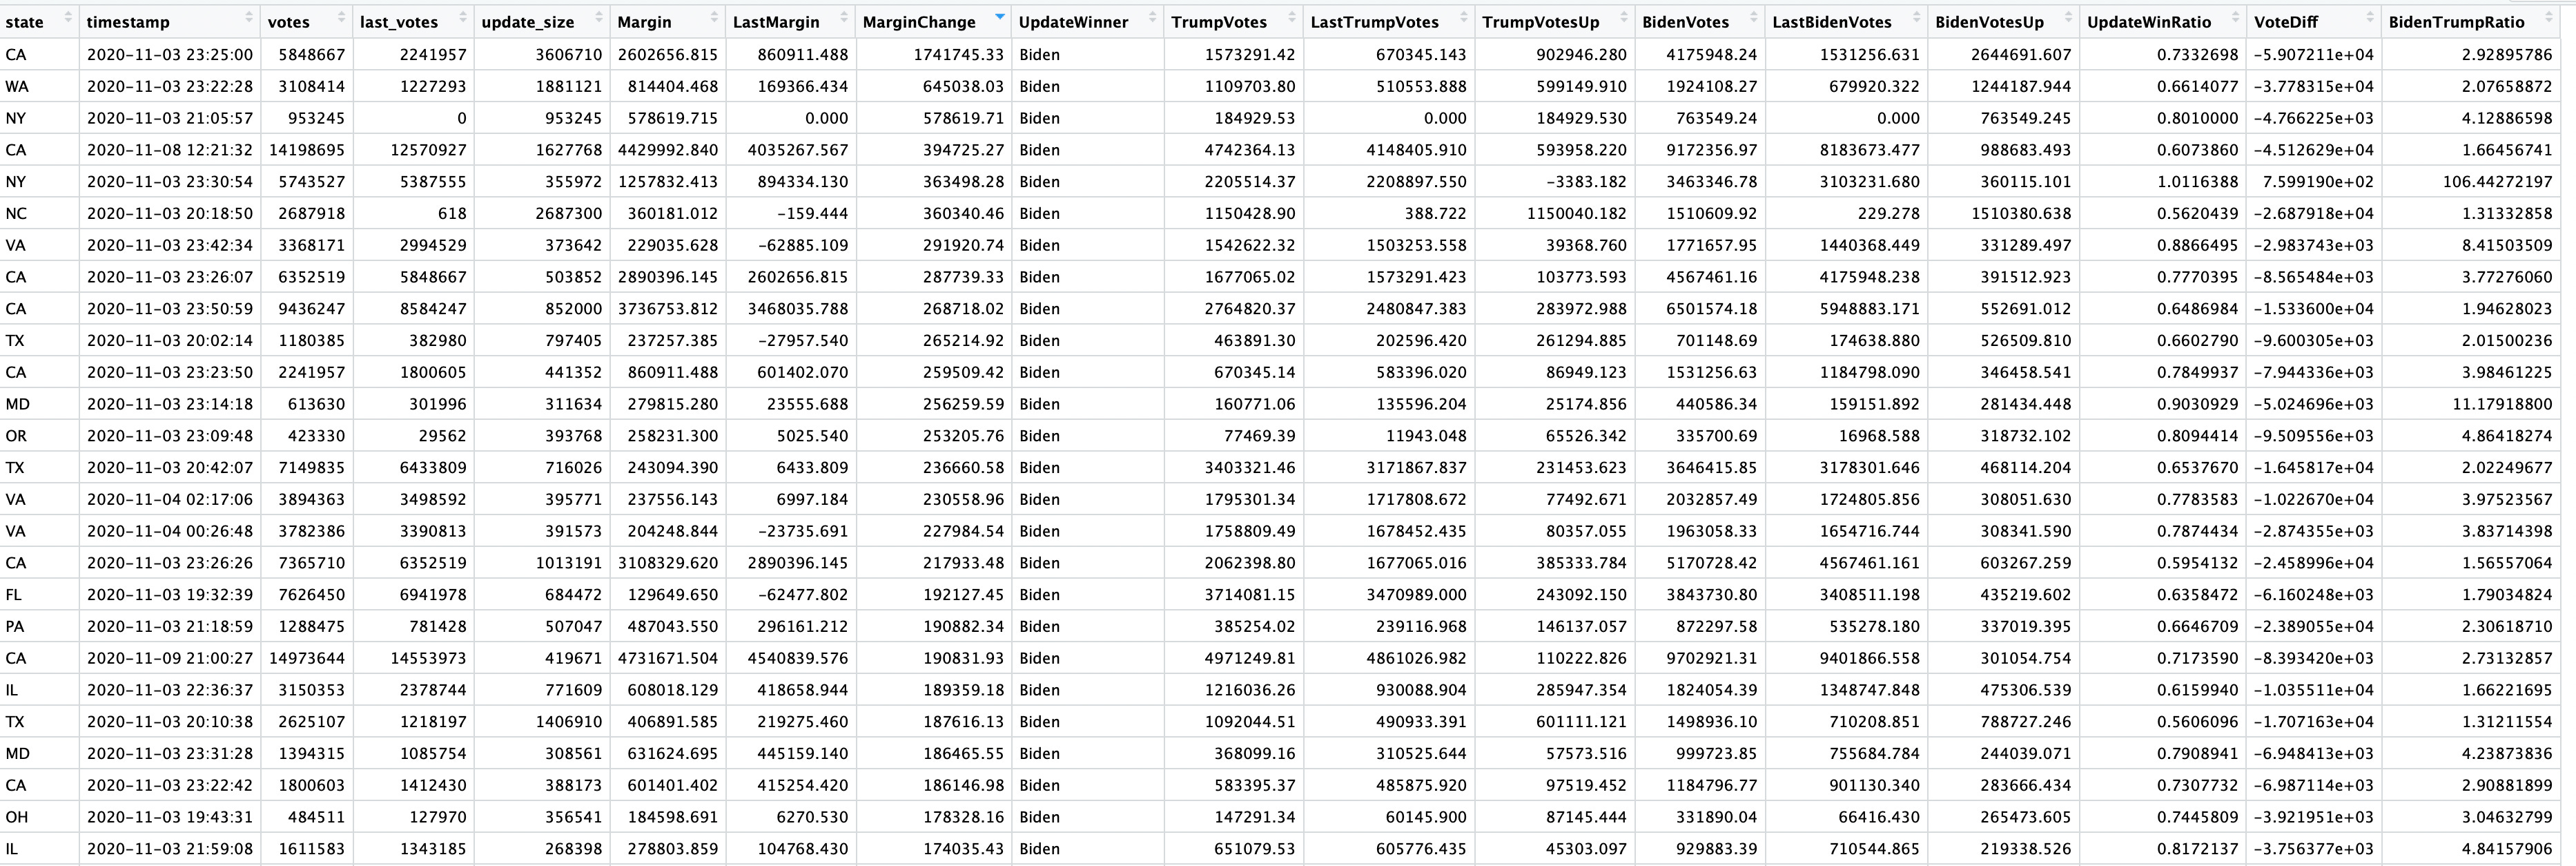
Instead of trying to get rid of these 300 or so unbalanced updates, I’m going to sidestep the issue the same way “Voting Integrity” did, by using a win ratio that doesn’t bring the total vote count into the ratio. Instead I’ll use the Biden / Trump ratio for each vote update. This is essentially the last graph in Voter Integrity’s collection.

There are lots of outliers. First off, there are 27 updates that are not plotted at all because the ratio is NaN (not a number). Those are the updates where the the Biden count and the Trump count did not change from the previous update so the ratio is 0 / 0 (or NaN). I’m guessing we can safely ignore these. There are also a bunch of interesting updates where the Biden ratio is extremely high, listed below. The first is clearly not a normal update - it’s of size zero votes, but transfers 6614 votes to Biden.

If I look at the margin change outliers, the first few positive margin change outliers look reasonable, large updates with relatively small ratio differentials, early on election night.
Many of the largest negative margins, by contrast, are ones where the vote update was negative, or votes were removed from the tally, so more suspicions.

If I zoom in on the chart above, I really only see two mid-range points that are outliers. Did Voting Integrity investigate those ? Not really.

The two biggest mid-range outliers are from NY, not WI, MI, or other battleground states.

If I zoom in further, I can discern a couple more mid-range outliers that really don’t look like outliers in comparison. Not exactly a smoking gun or even much of a sign. But we have finally found one of Voting Integrity’s four suspicious updates, but we have identified many other suspicious updates along the way.

Just for fun, I did a flip on the y axis by inverting the Biden/Trump ration into a Trump/Biden ratio, and applying the same anomaly criteria. I came up with only on anomaly, but it was a whopper, pointing to cheating for Trump in Pennsylvania ! Not that the horizontal scale is the same as earlier, but the vertical scale is 10x.

And there are 4 other Trump/Biden ratio anomalies that almost met the earlier criteria, so these anomalies appear to affect both Biden and Trump “wins” with similar regularity. Here are the 5 vote updates that look suspiciously like Trump cheating based on Voting Integrity’s methodology.
