The "Anomalies" You Should Have Seen...
The Anomalies Voting Integrity forgot to tell you about the biggest anomalies along the way.

I attempted to repeat the anomalies in this article using the exact same data source provided the author, but ran into the anomalies Voting Integrity didn’t tell you about.
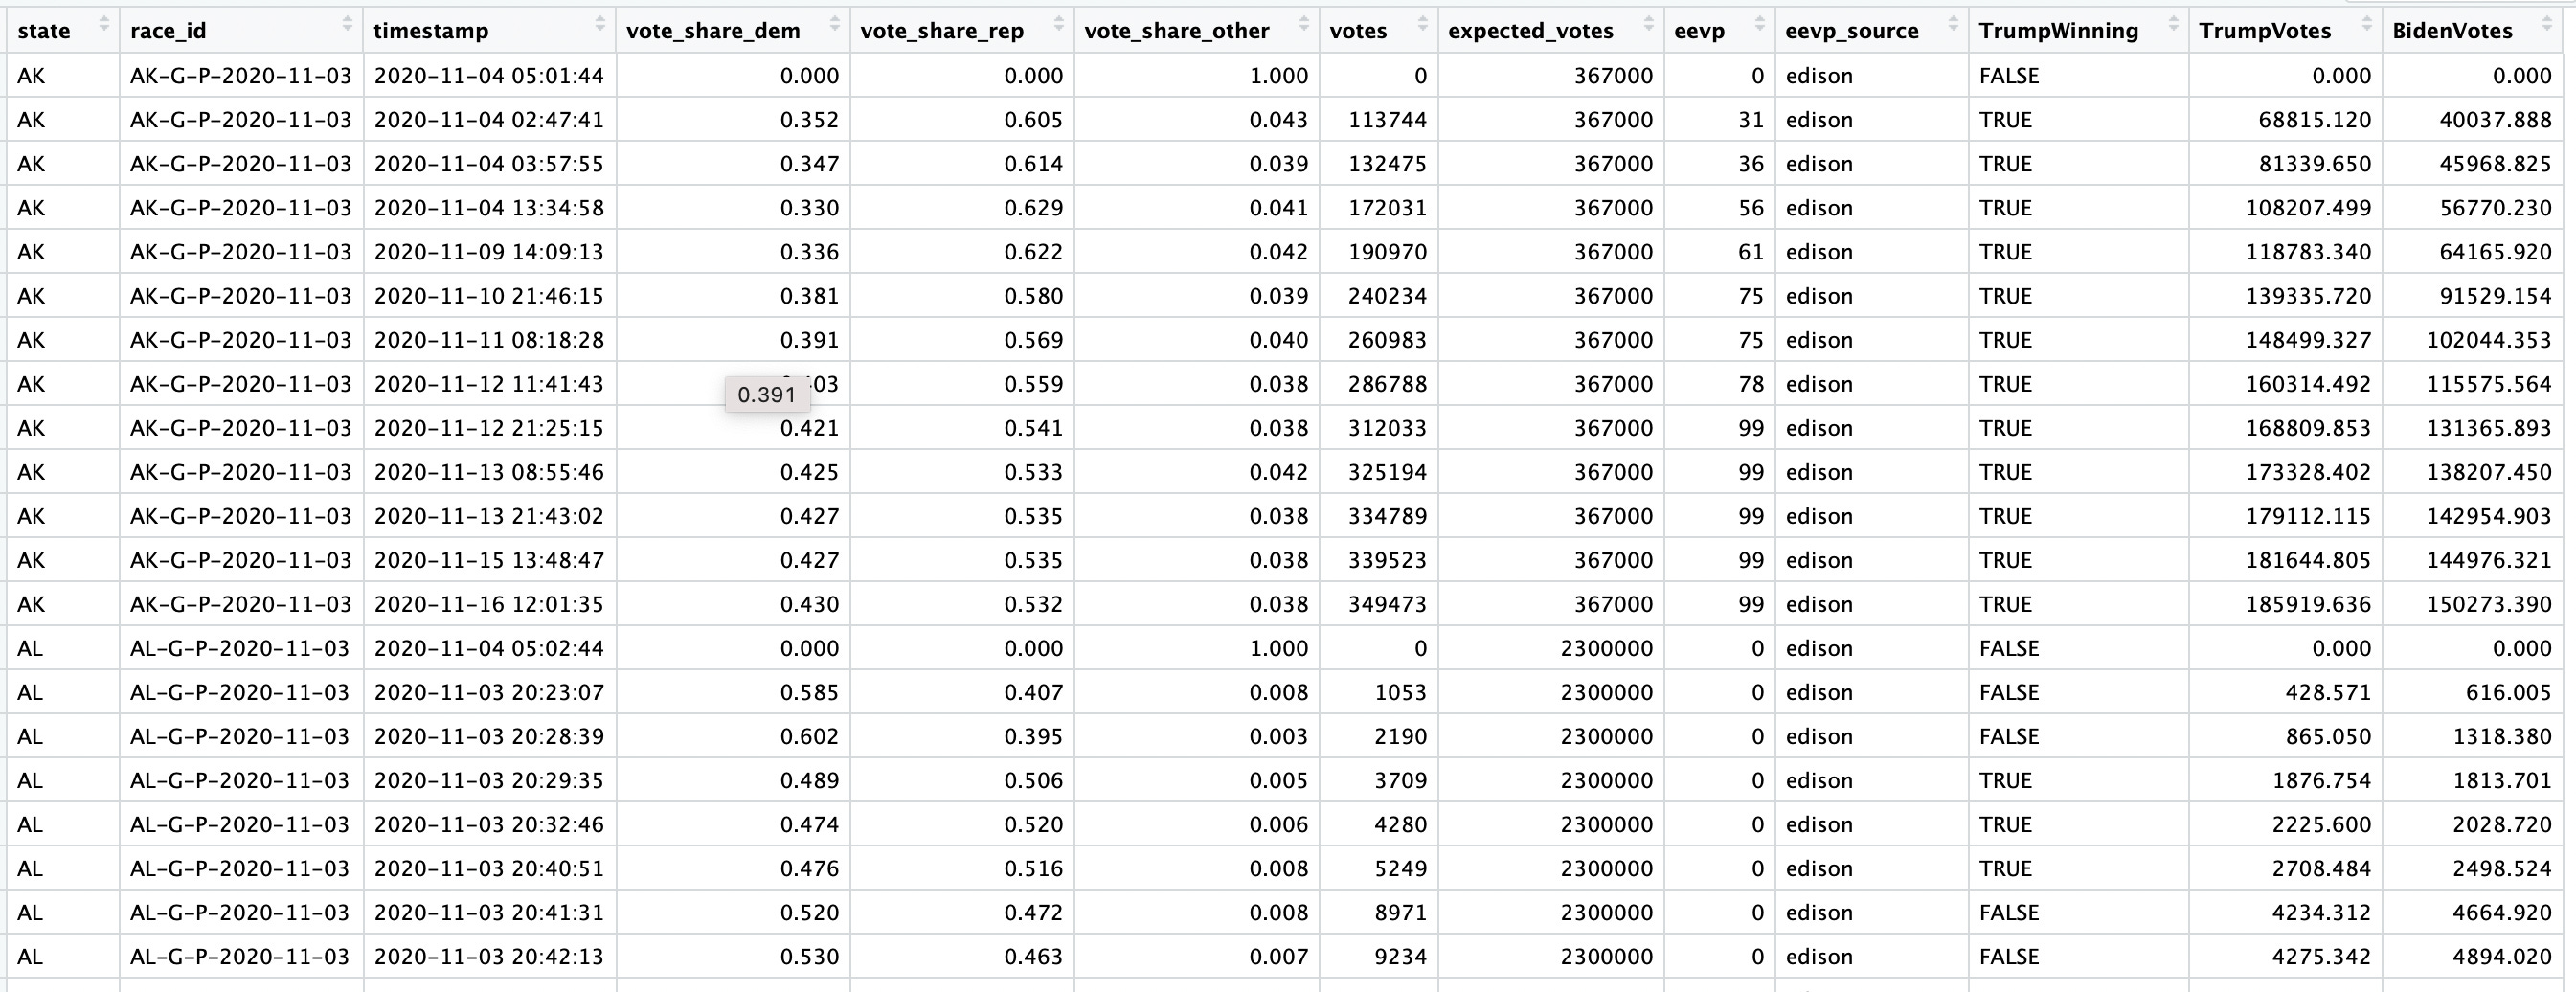
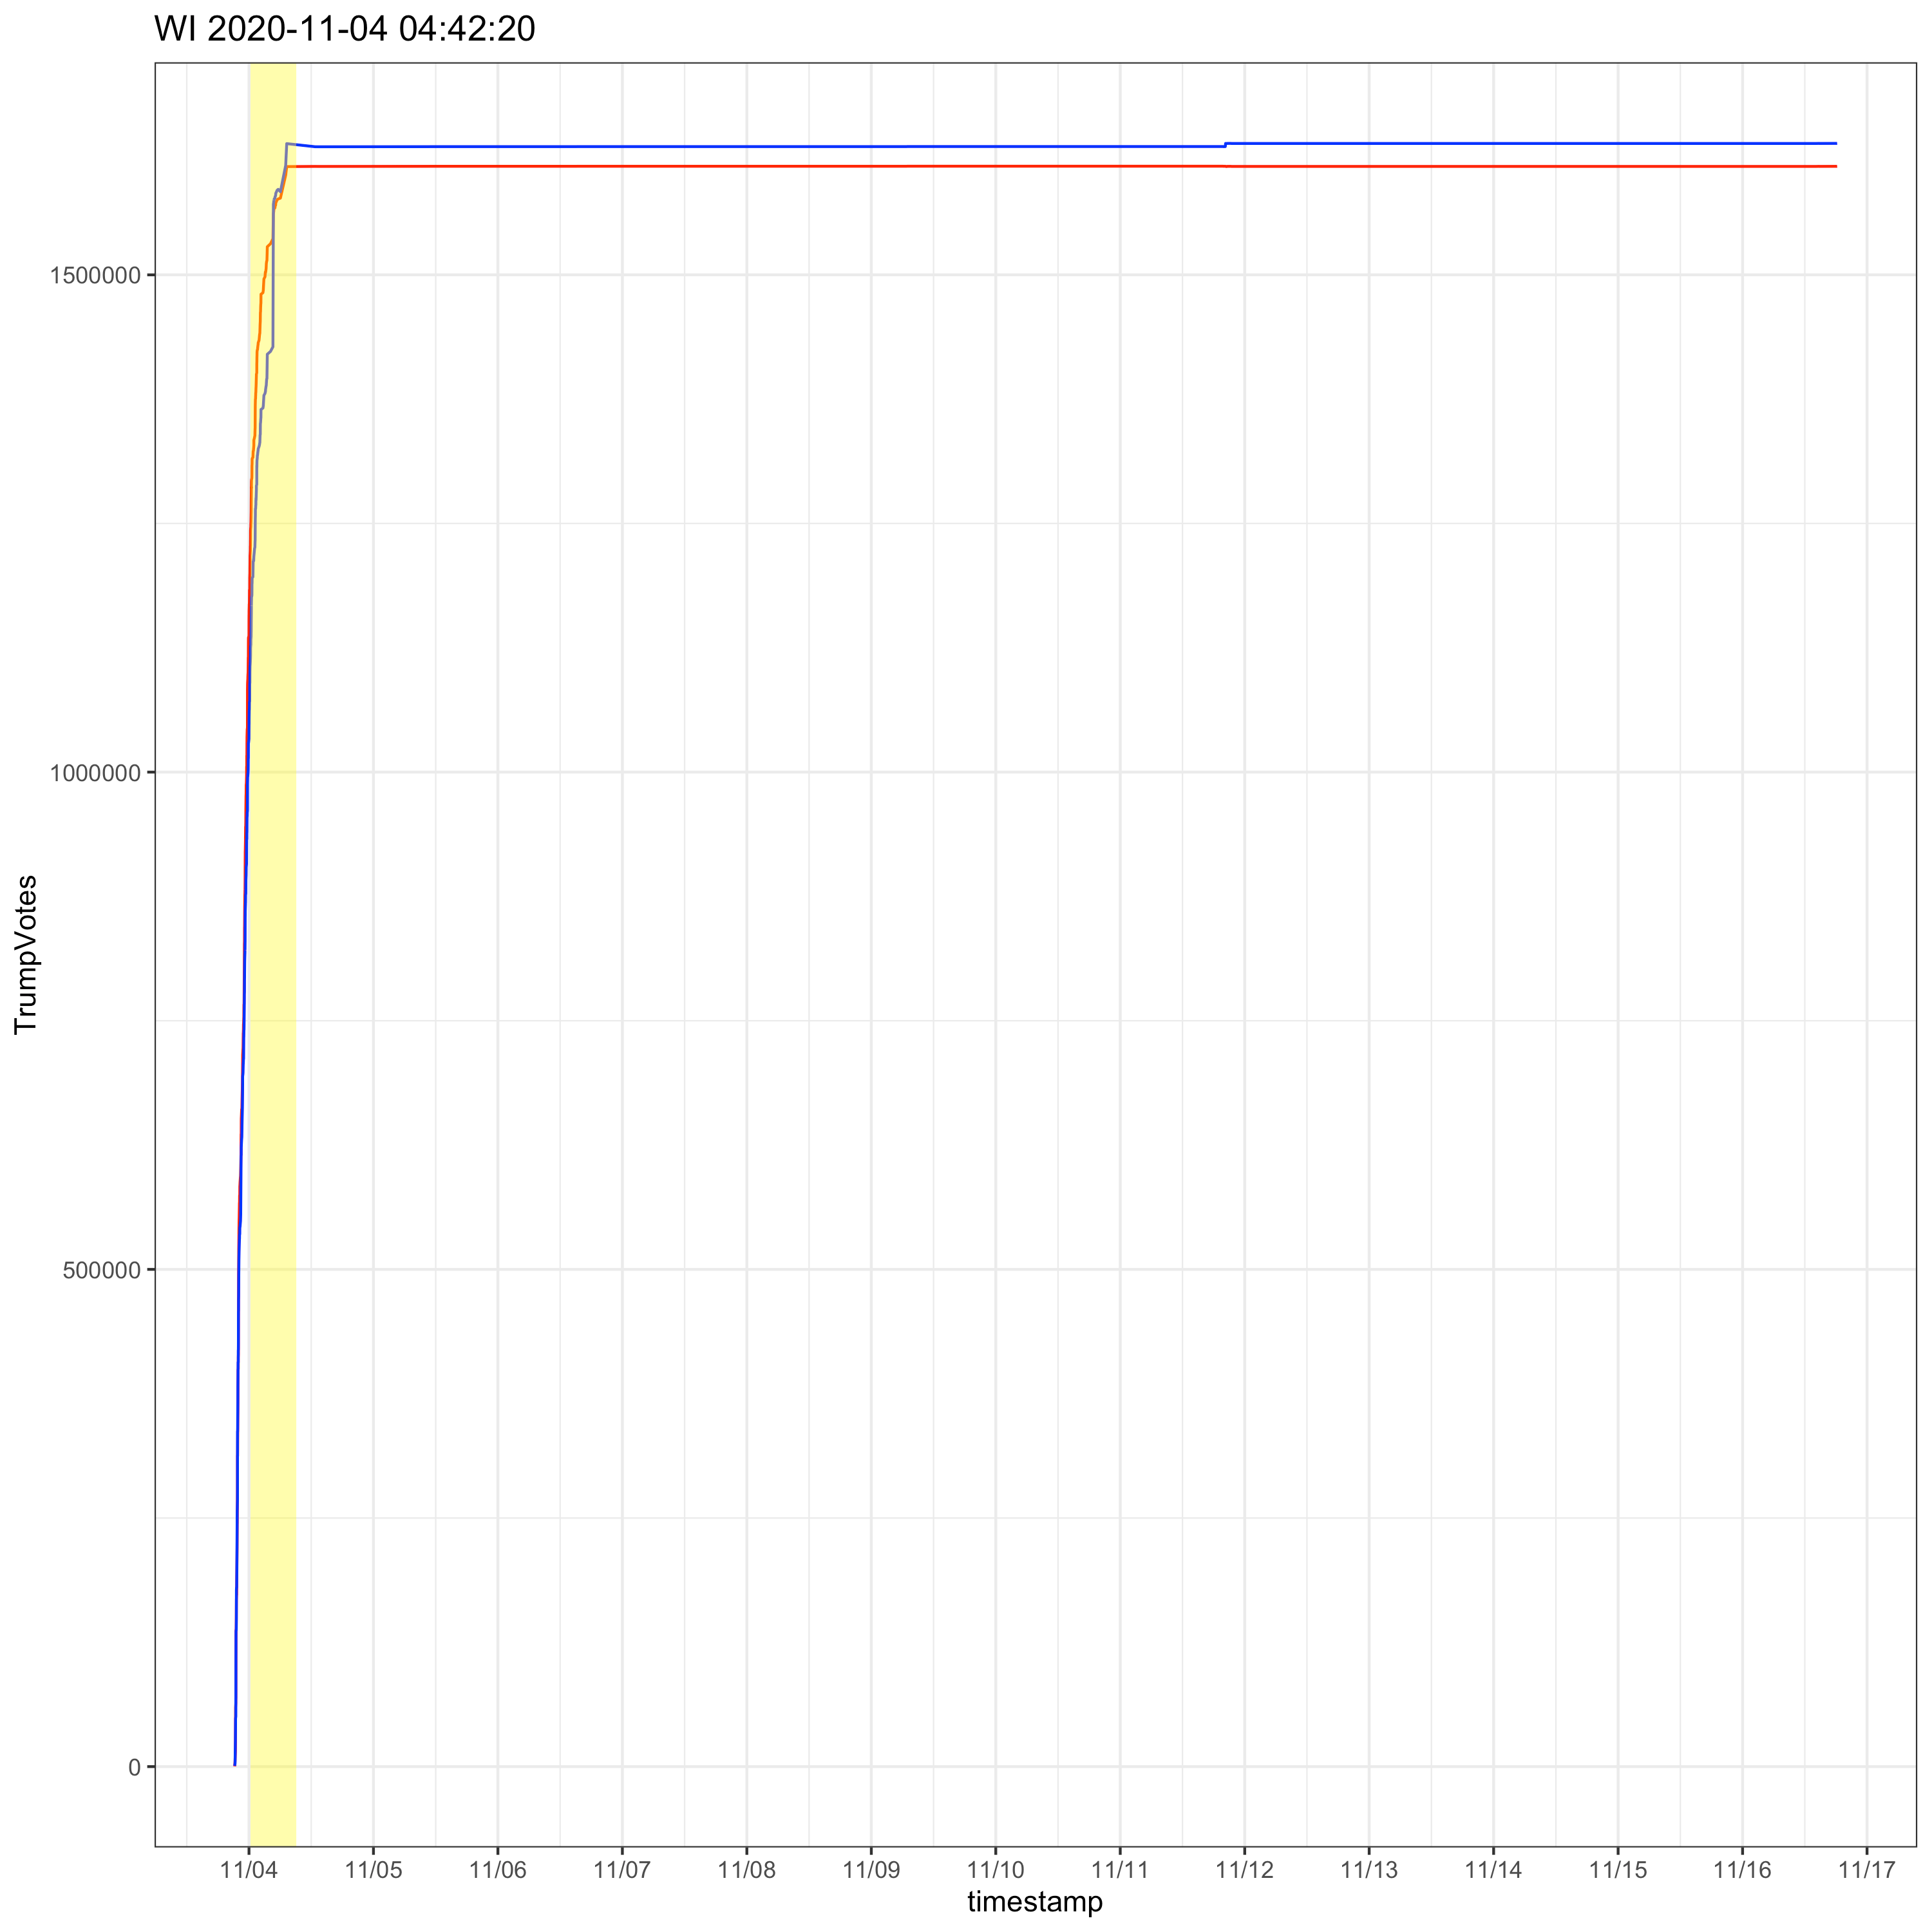
My first step was to read in the author’s source data and create similar Trump vs. Biden vote graphs. I read in the data, converted the timestamps to US Eastern time and then created derived columns for the Trump and Biden vote counts, as well as a boolean for graphing, that indicates when Trump is winning and not. Here’s the general form of the data in the author’s dataset.
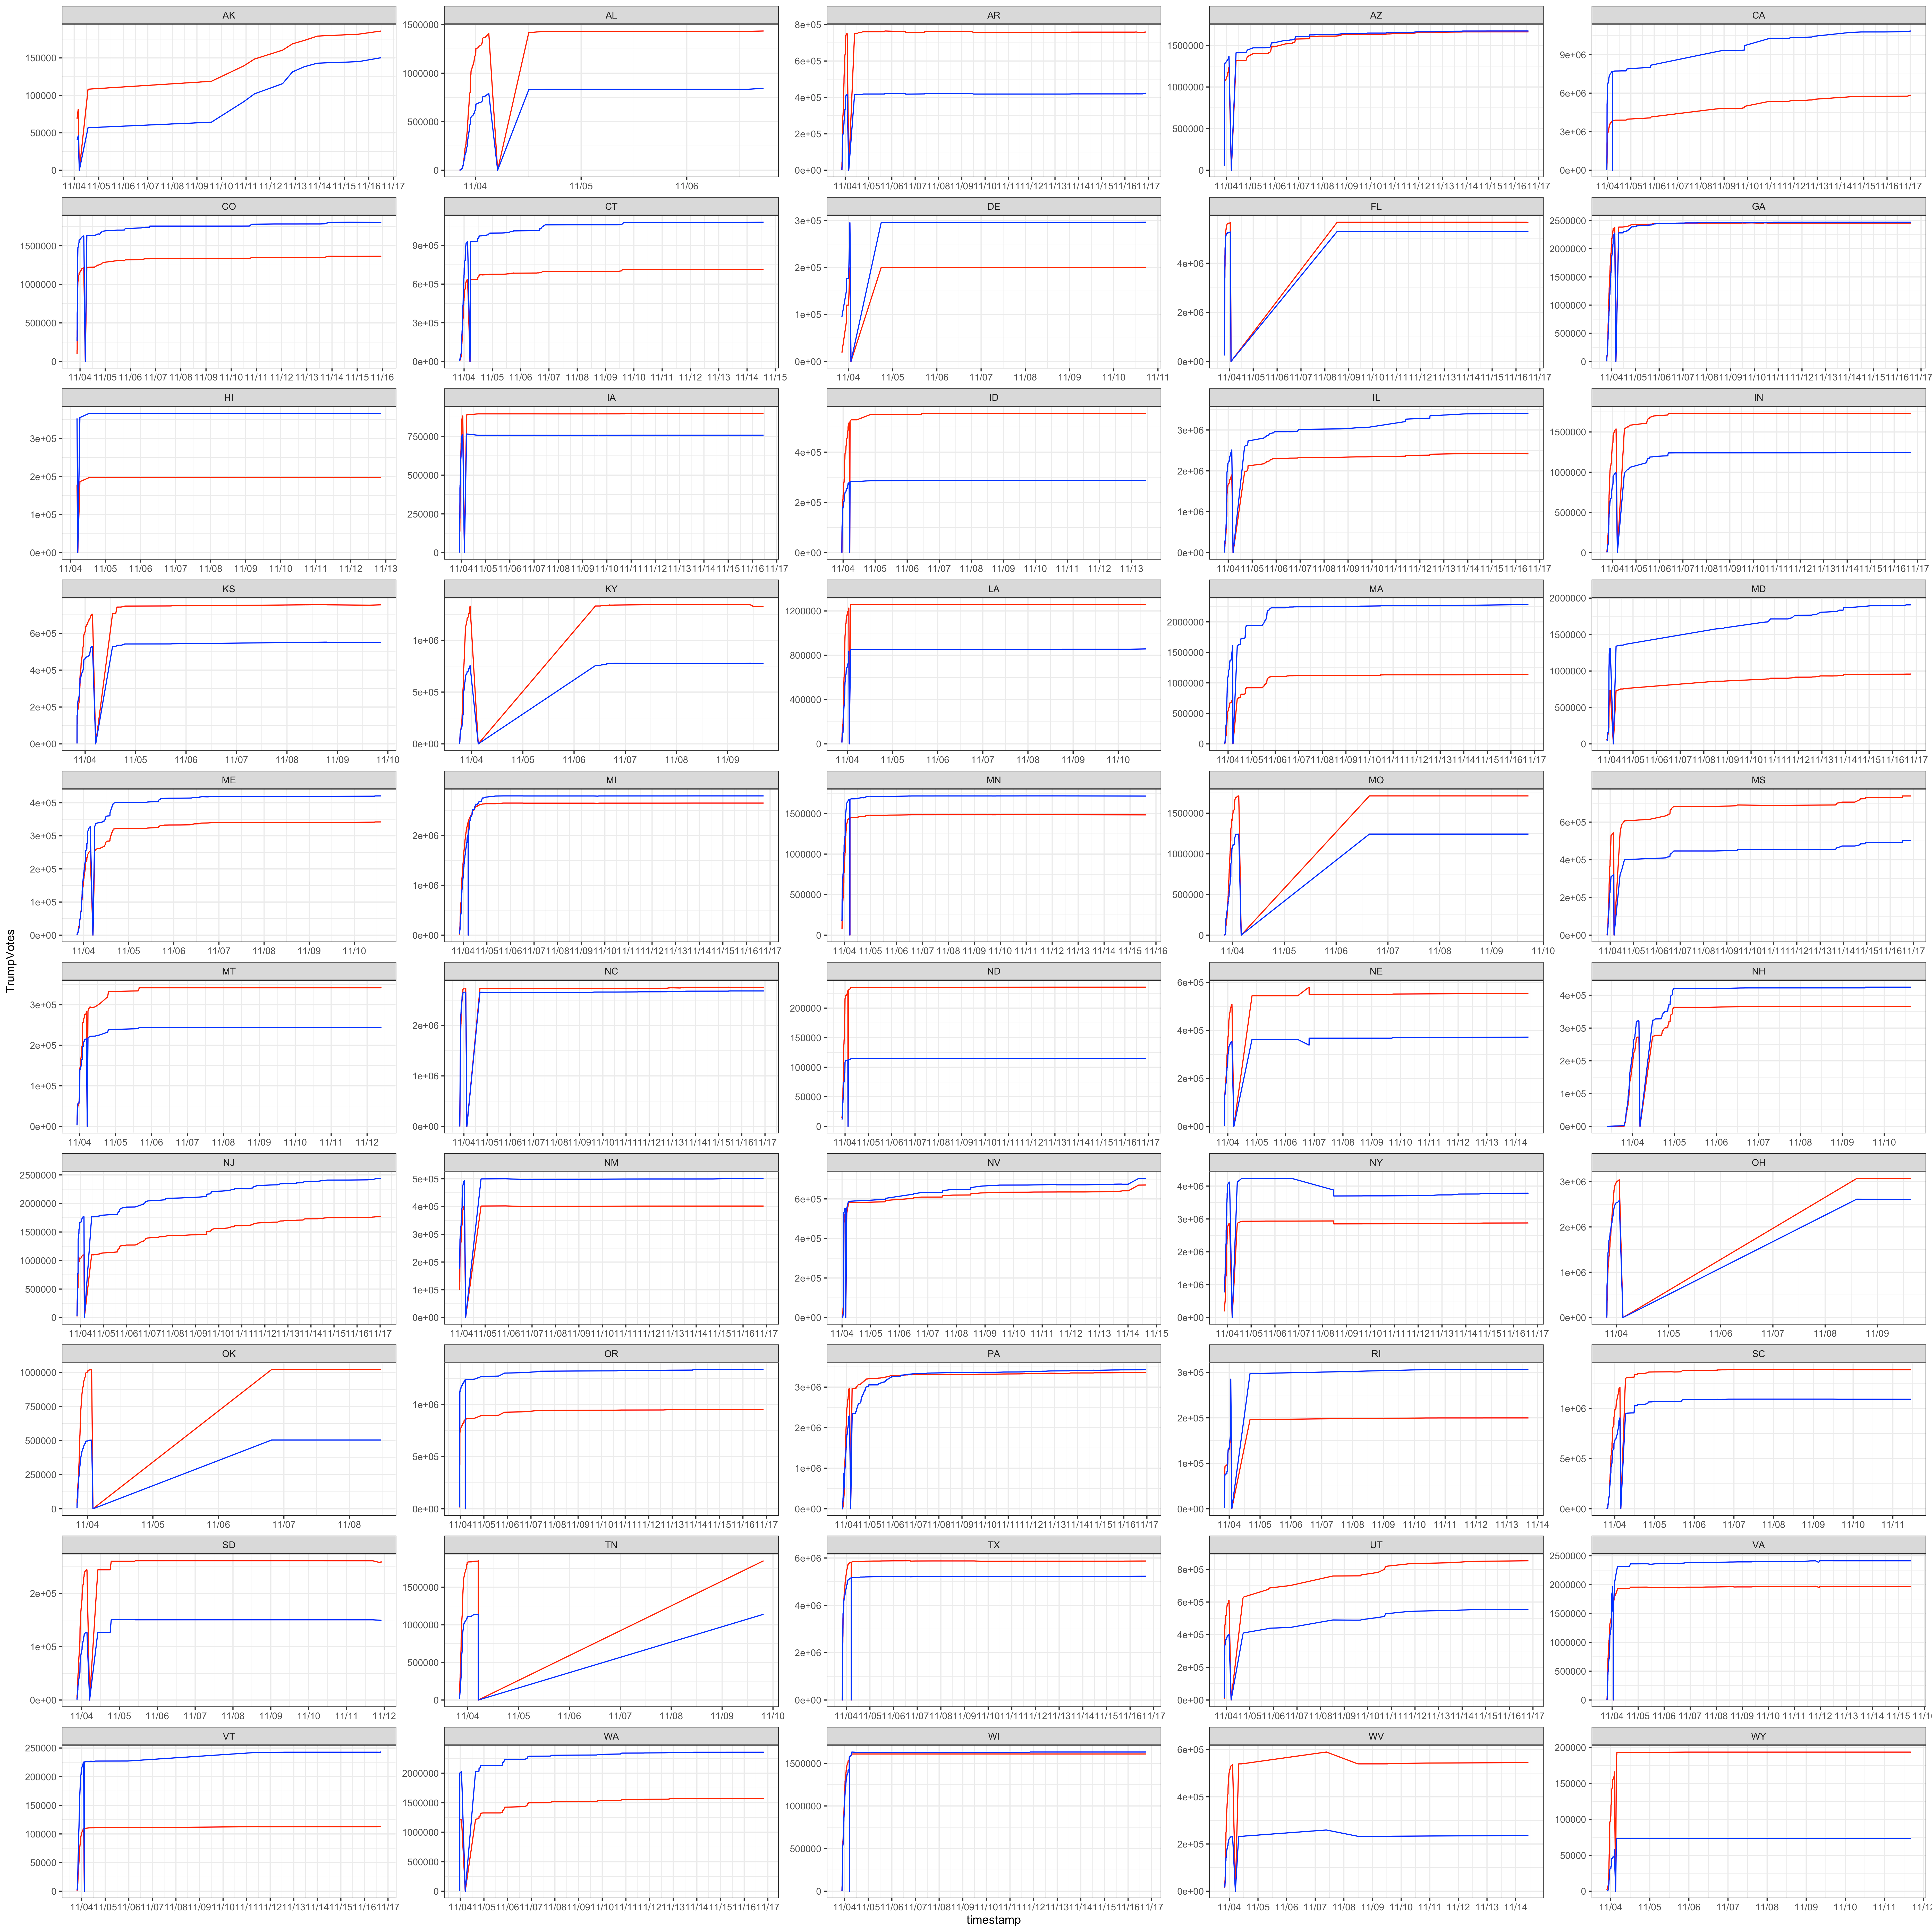
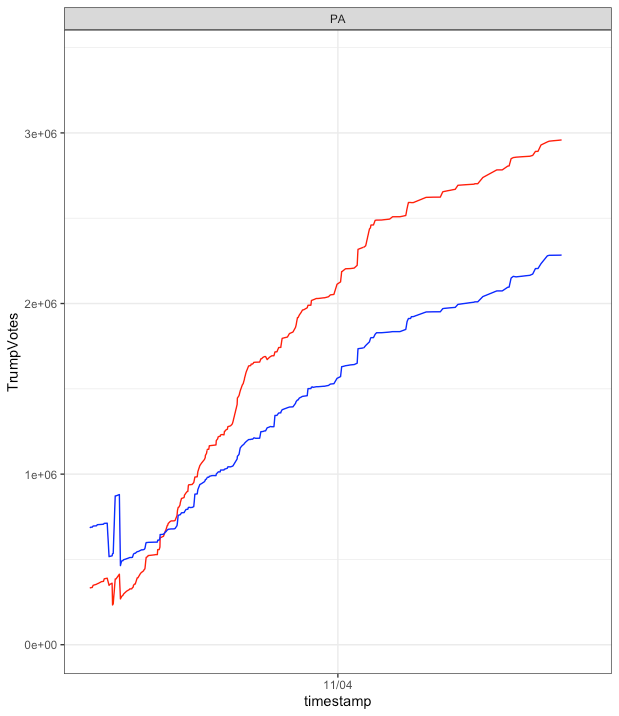
My next step was to create a vote count chart for all the states using a facet-wrapped set of plots. My main goal at this step was to look for any strange patterns in some subset of the states. The immediate anomaly that stood out, was one the original author never highlighted. Every state has a bad zero vote data point that is clearly out of place.
After removing the zero point anomaly, I can scan all the states for other potential issues. Very quickly another anomaly in this poster’s dataset becomes clear. Two states, NY and WV in the red boxes, have vote totals falling over time a couple days after the election ! Why did our poster not alert us to these “stolen votes” ? I’m going to ignore the mystery of disappearing votes for a bit while I delve deeper into area that was deemed most important by the original author.
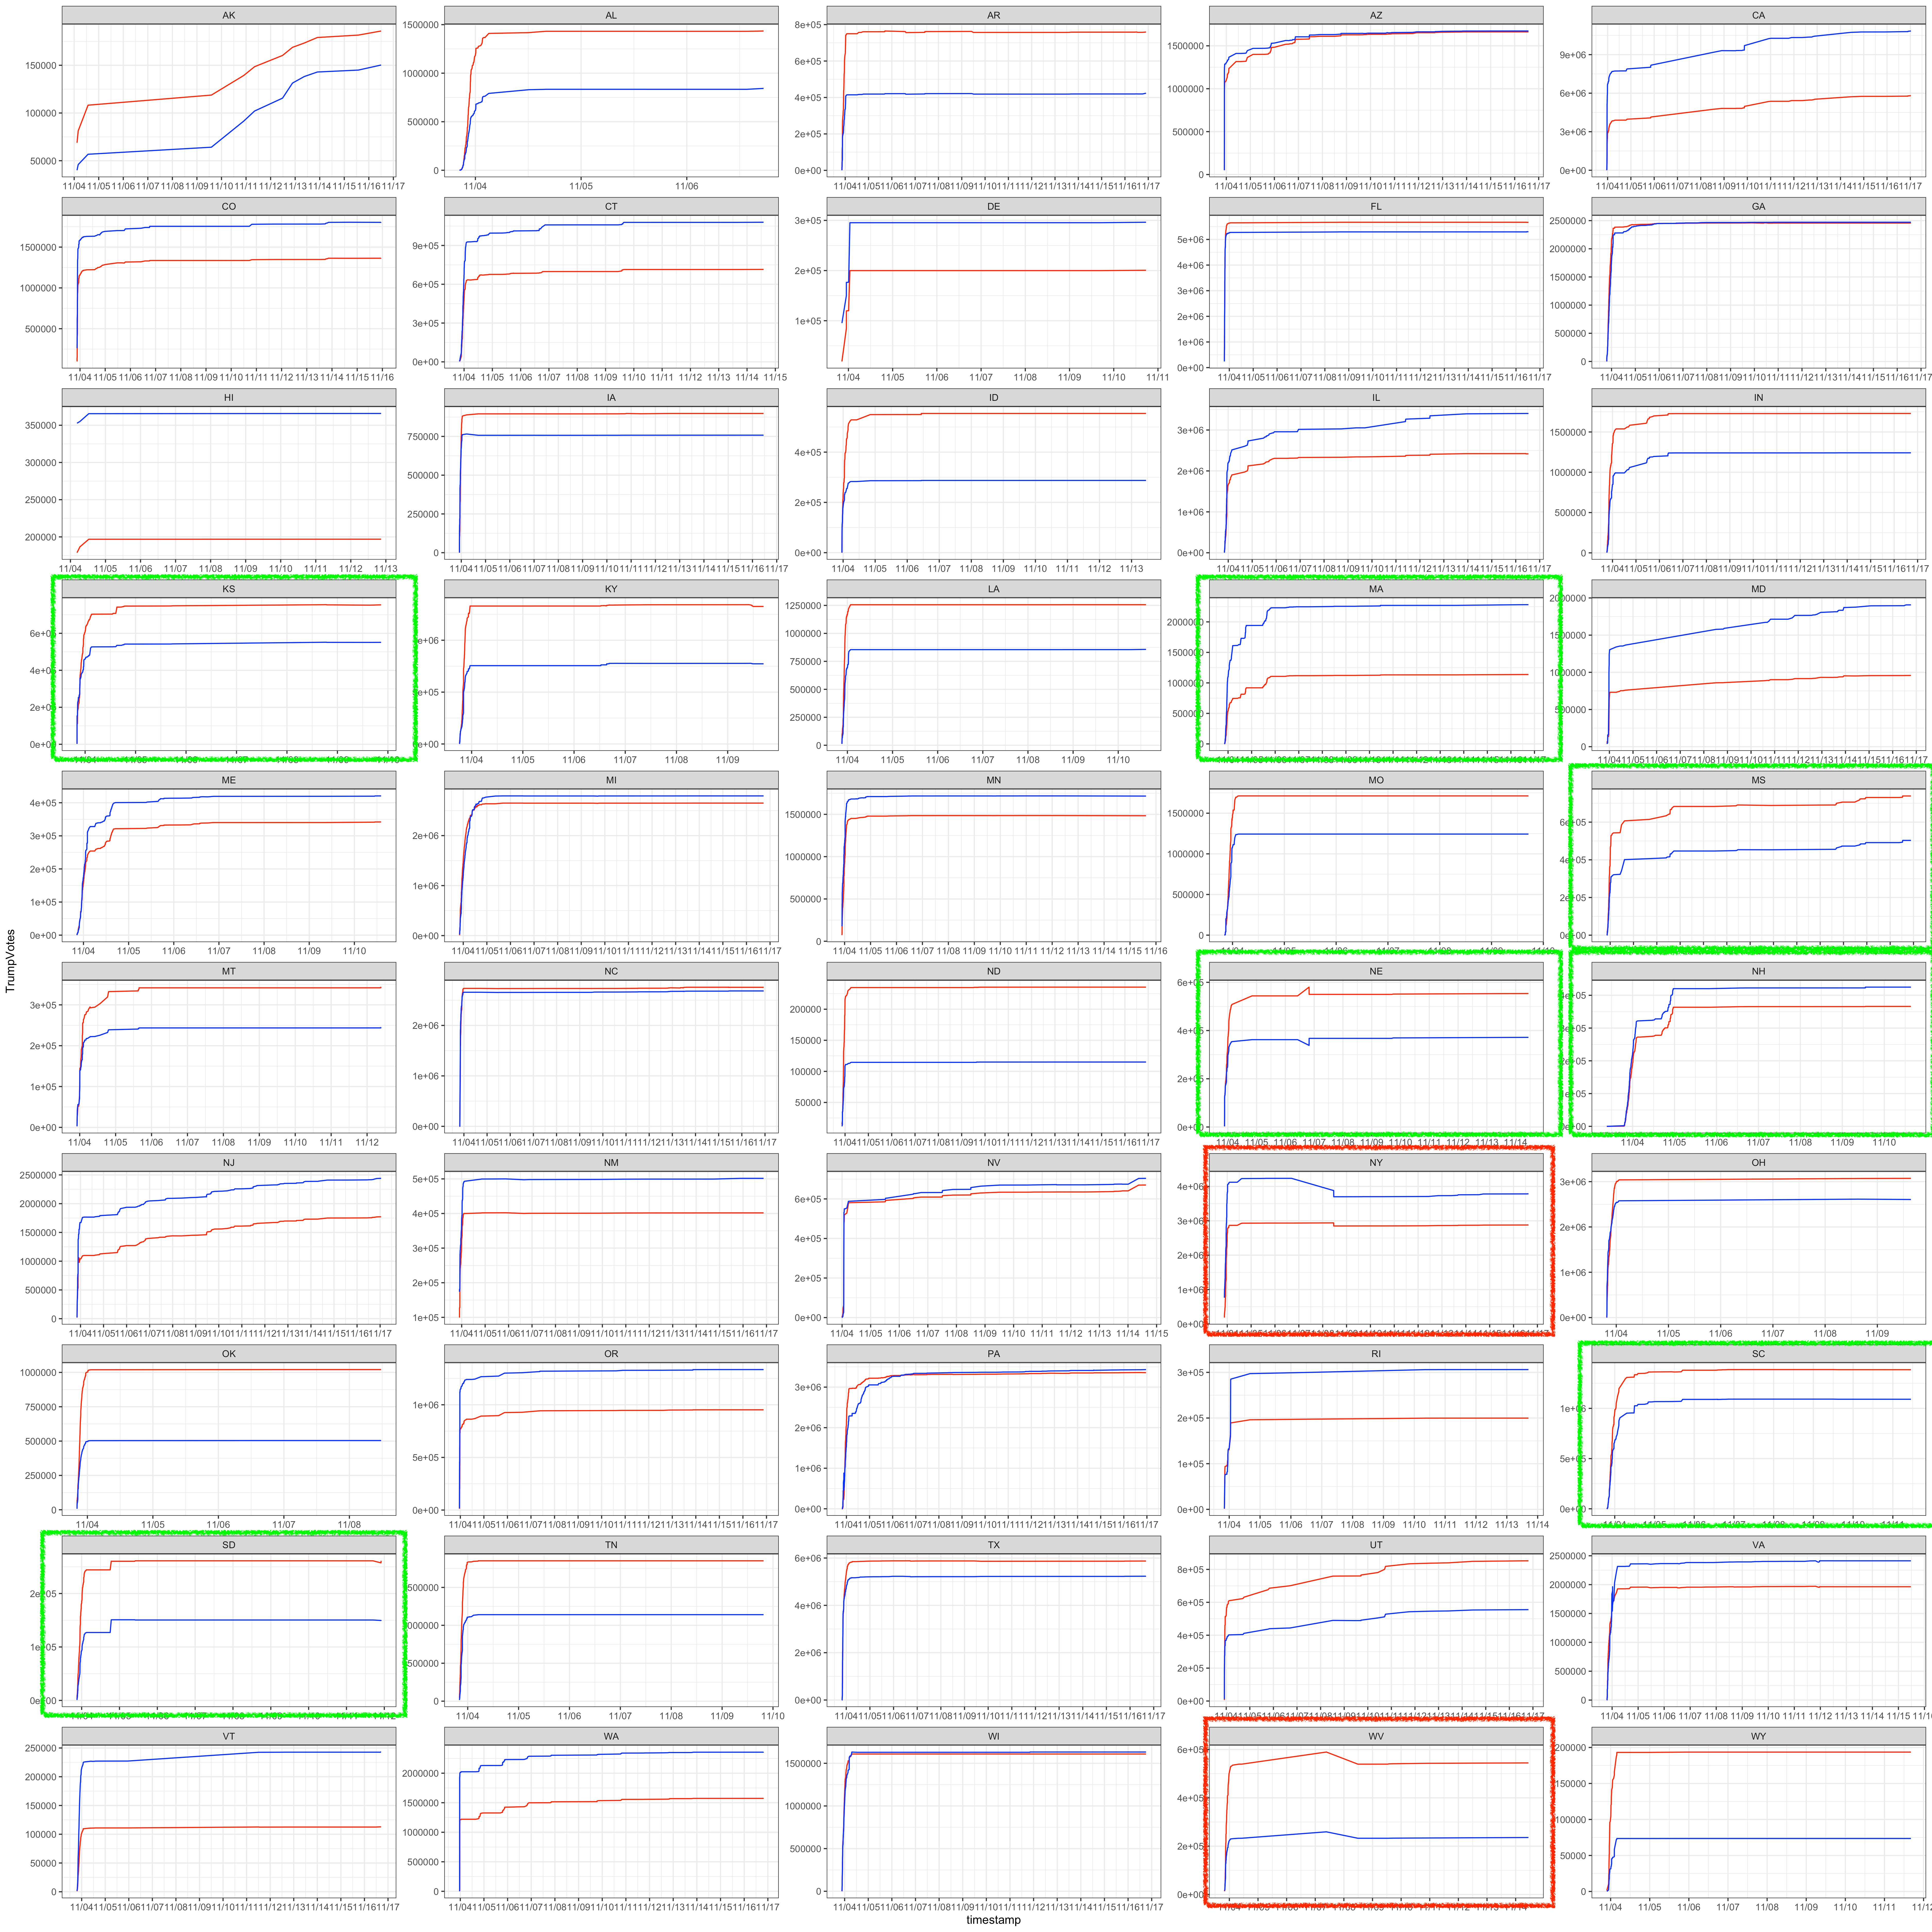
The original author made such a big deal about large vote updates, that I decided to do the same and visually identified the biggest jumps in votes, using the bright green boxes ( KS, MA, MS, NE, NH, SC, SD) for further analysis. I’m also going to take a similar detailed look at the “contested” states.
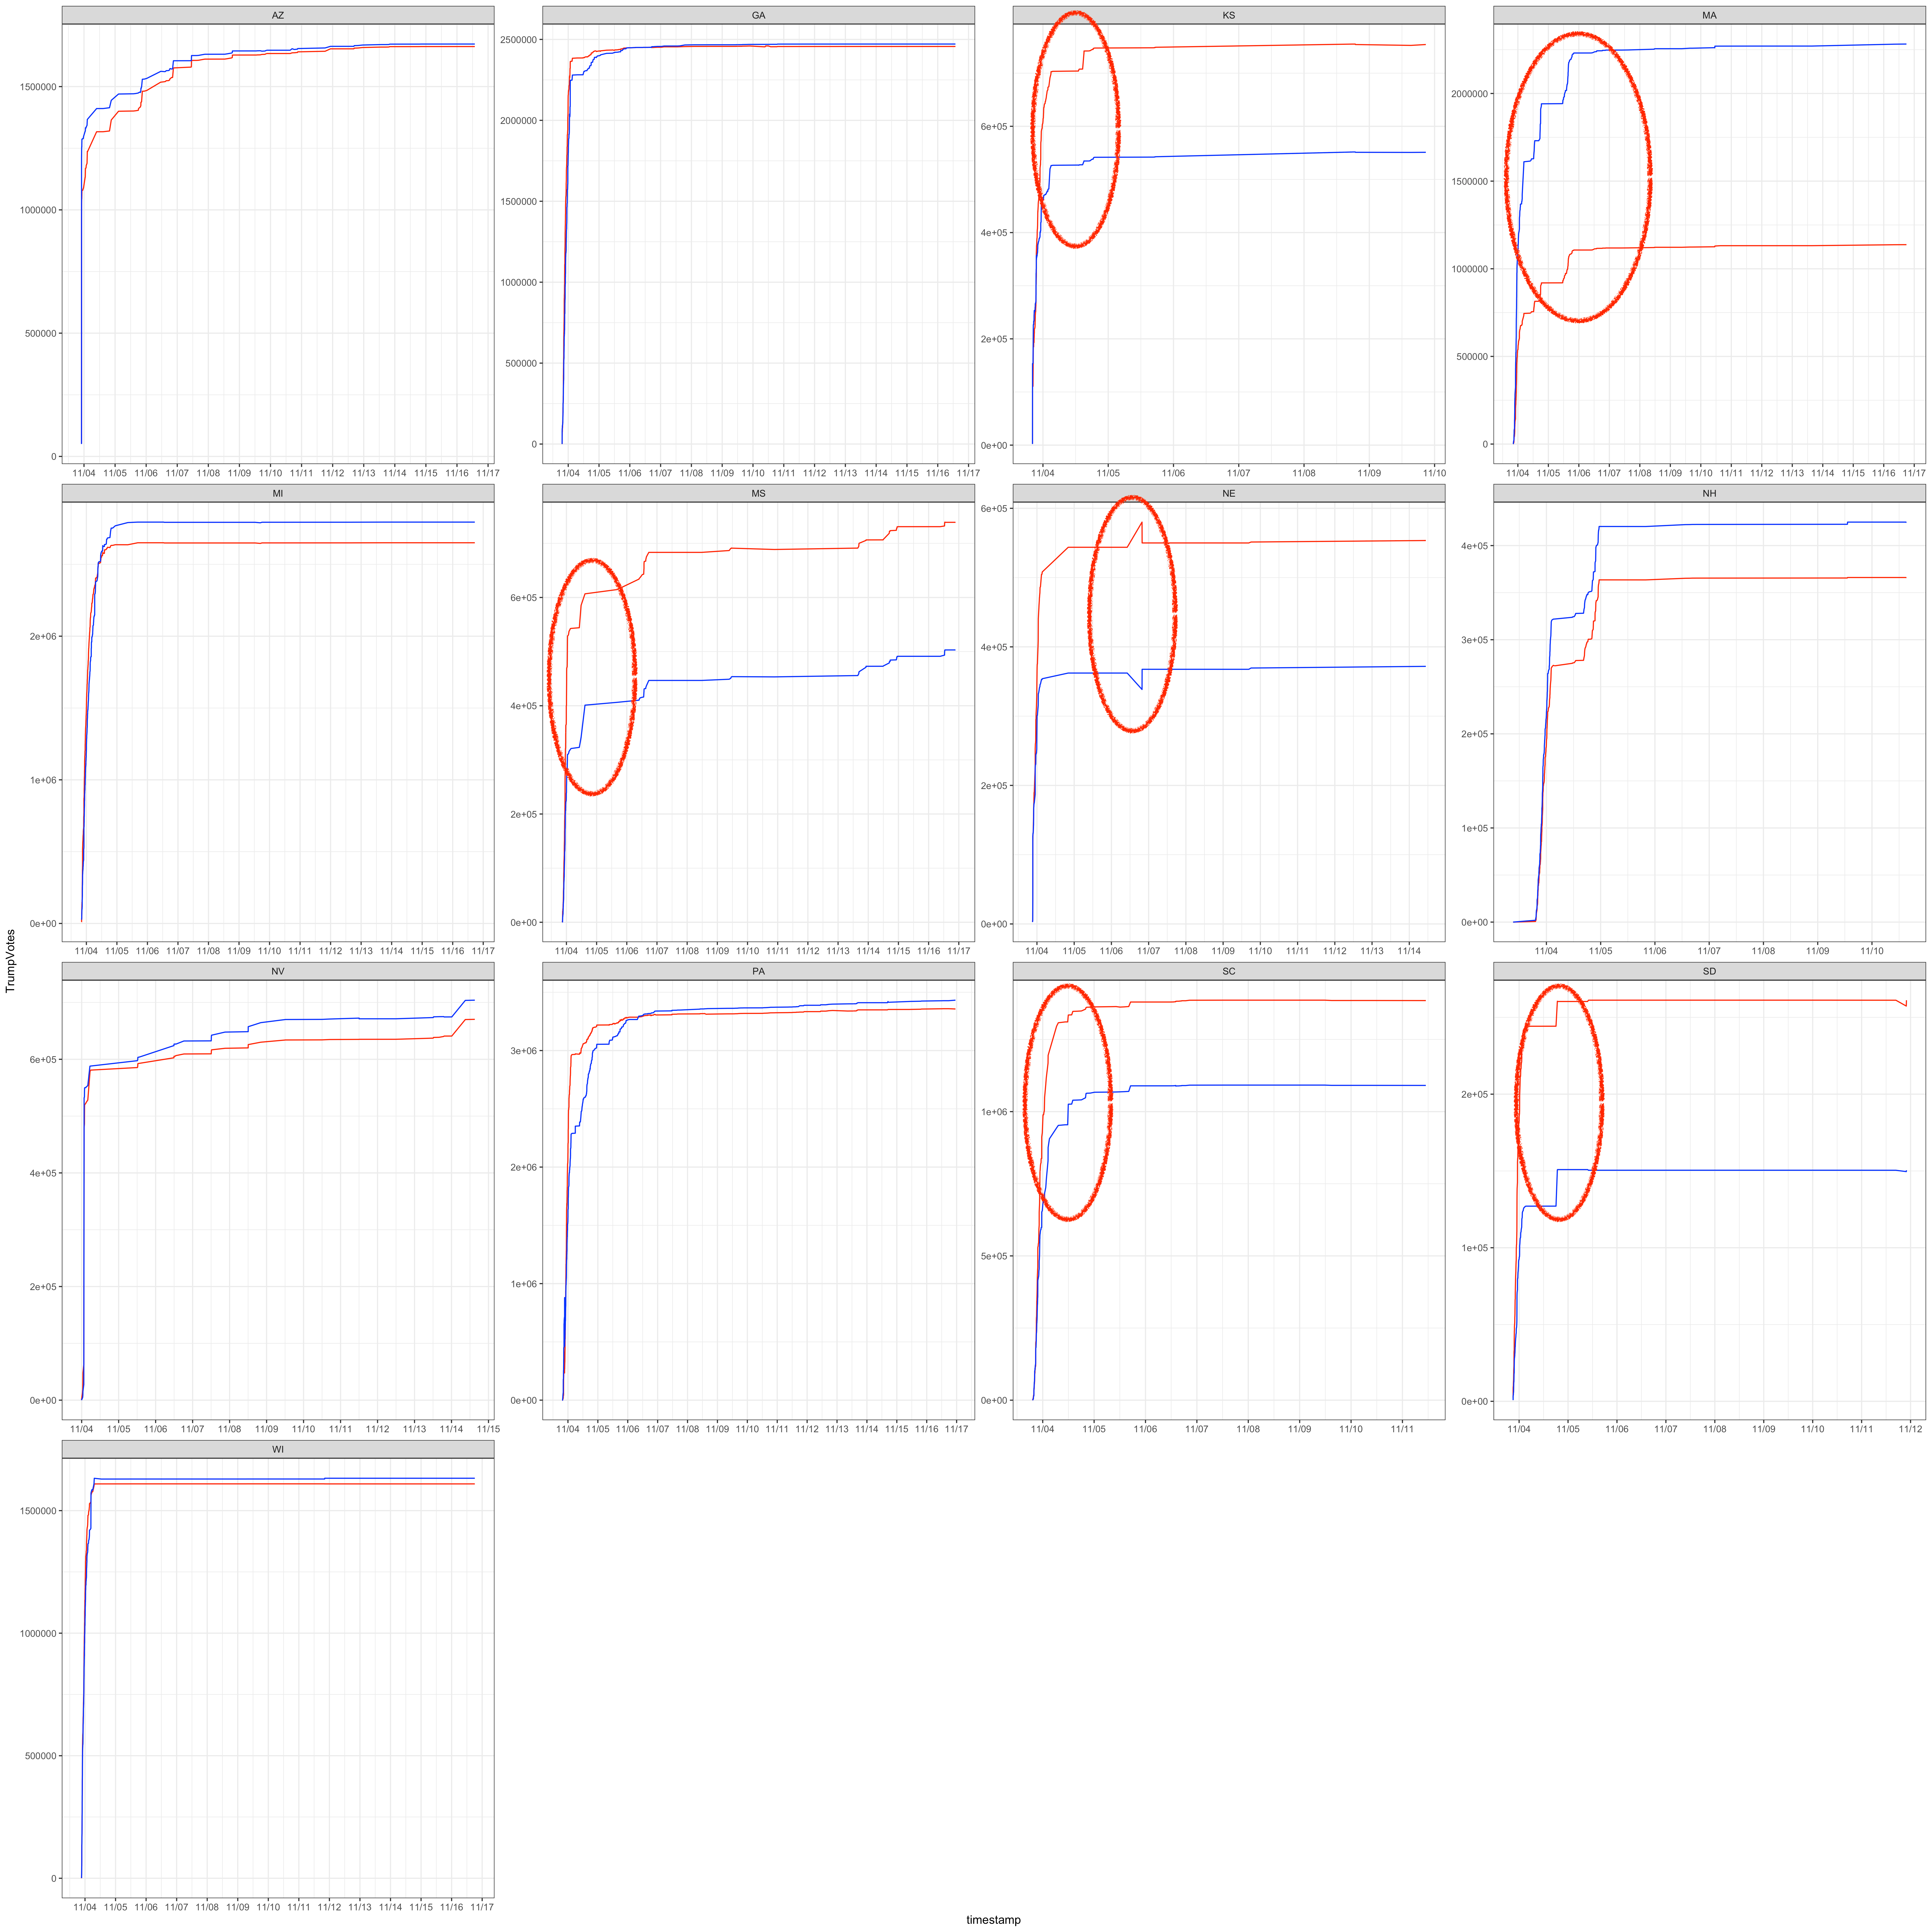
If big vote updates that change the margins the most indicate the potential for fraud, I would be investigating the circled vote updates in KS, MA, MS, NE, NH, SC and SD first, vs. much smaller bumps in WI and MI. It’s only in the context of filtering for updates that changed statewide results, that the MI and WI vote updates are even visible. If the original author were truly looking for the most unbalanced larger updates, they would have found the ones in read and labeled as anomalies.
Now let’s look in more detail at two big problems I spotted in the top level data, just via a cursory analysis, that should have triggered the “Vote pattern analysis” fraud alarm but didn’t.
Negative vote updates - are these really stolen votes ?
The biggest margin changes in vote updates vs. the final election results. But I’m going to look for the all cases, not just the cases in contested states where an update might tip the whole election.
Here’s a view of the largest negative vote updates, where the vote count actually decreased, in order from largest to smallest negative change. I added a last_votes column to compute this, as well as for reference. Wow, 586,189 votes went missing in PA on the night of the election ! How did ‘vote pattern analysis’ miss that ??
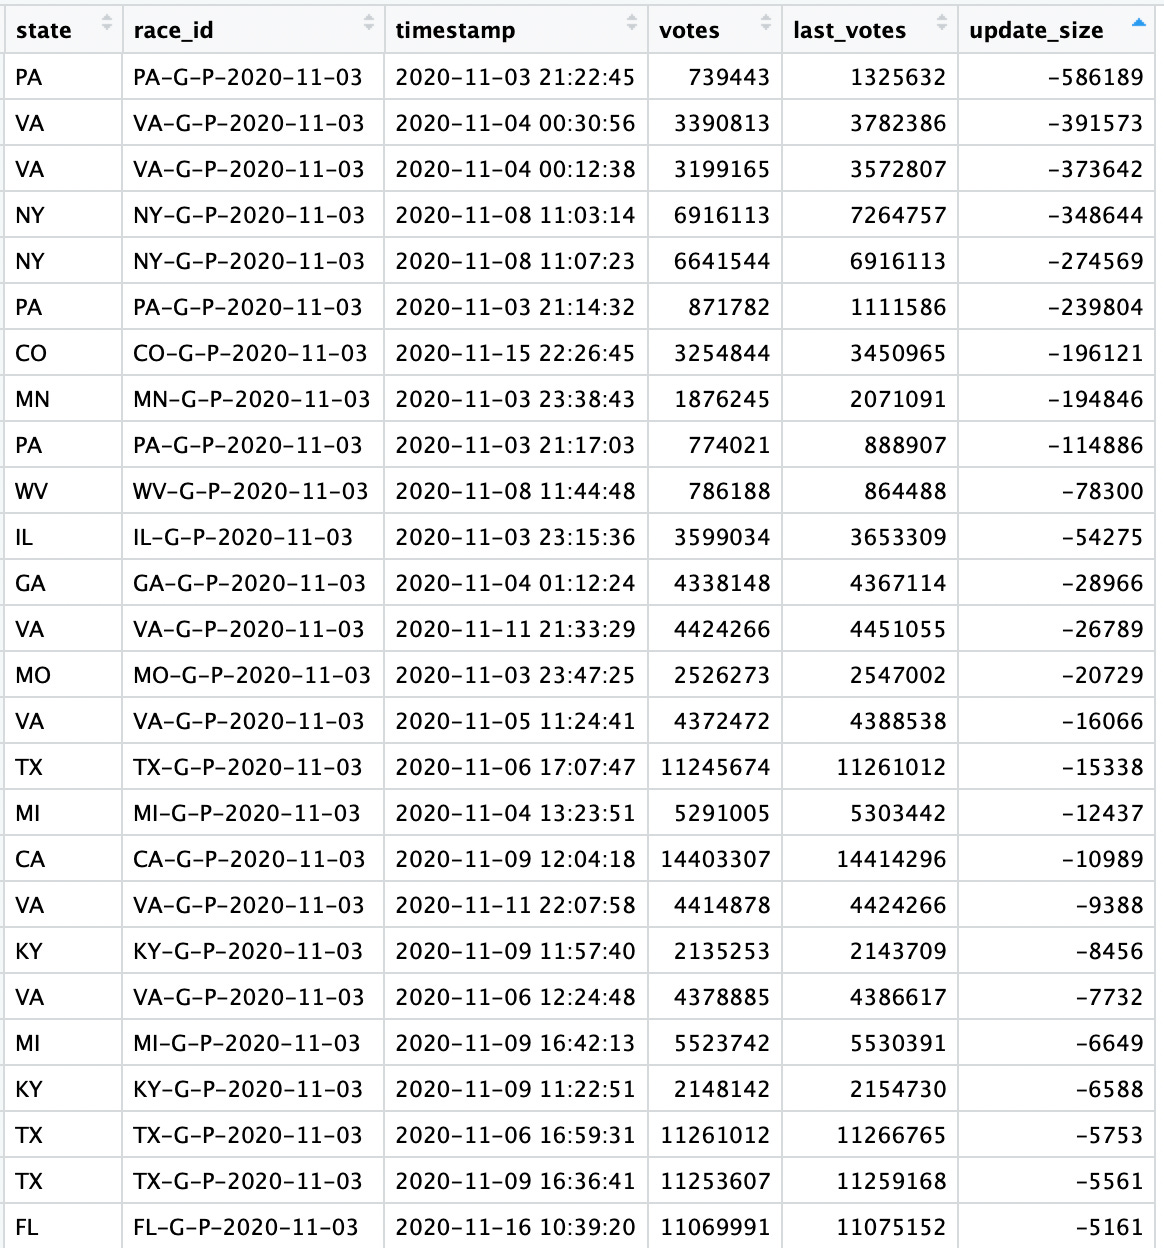
I didn’t notice this blip in PA my overall assessment of all the states. Did I really miss it or is it real ? And if it is real, is it “legit” ? Let’s look around in time neighborhood of that negative vote update, late on the night of Nov 3rd. Amazing, there were 3 large negative vote updates in PA in the same hour ! Again, how did “Vote Integrity” miss this ?
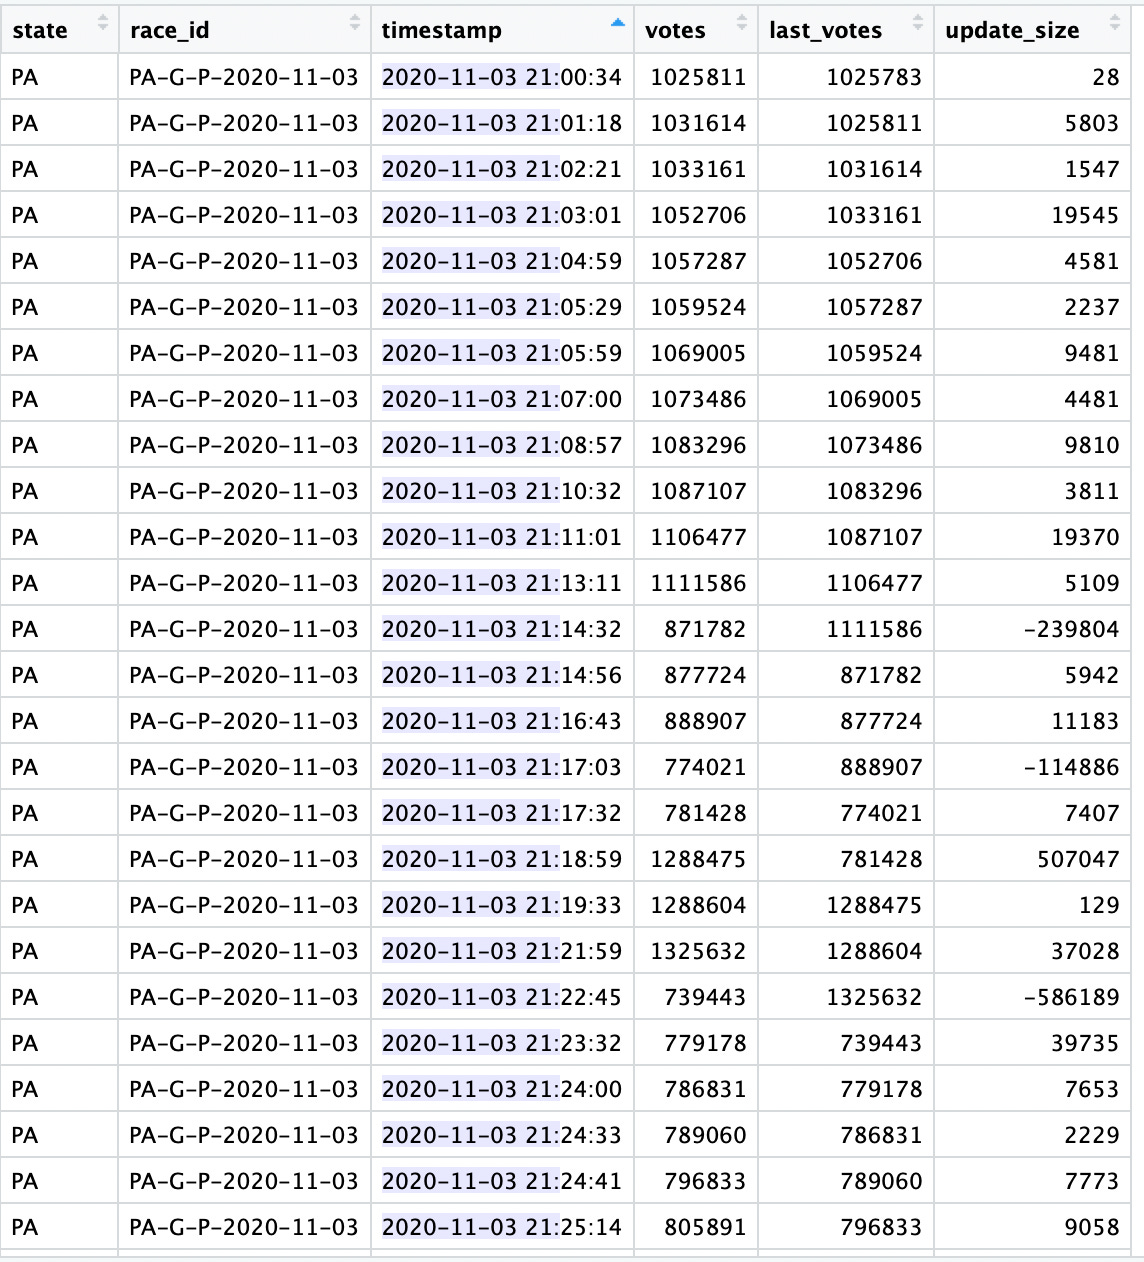
I can understand how I originally missed it, in my big picture glance at all the states. The drops in votes were buried in a flurry of election night counting so they were essentially covered by upticks in the vote count, until I expanded the time scale around election night. Looks like a whole lot more votes were “stolen” from Biden than Trump. Was this fraud - not likely. Probably more like updates and adjustment in the data due to entry errors, reconciliation between absentee ballots and in-person voting, etc. But the main point here is that this dataset has lots of ugliness in it.
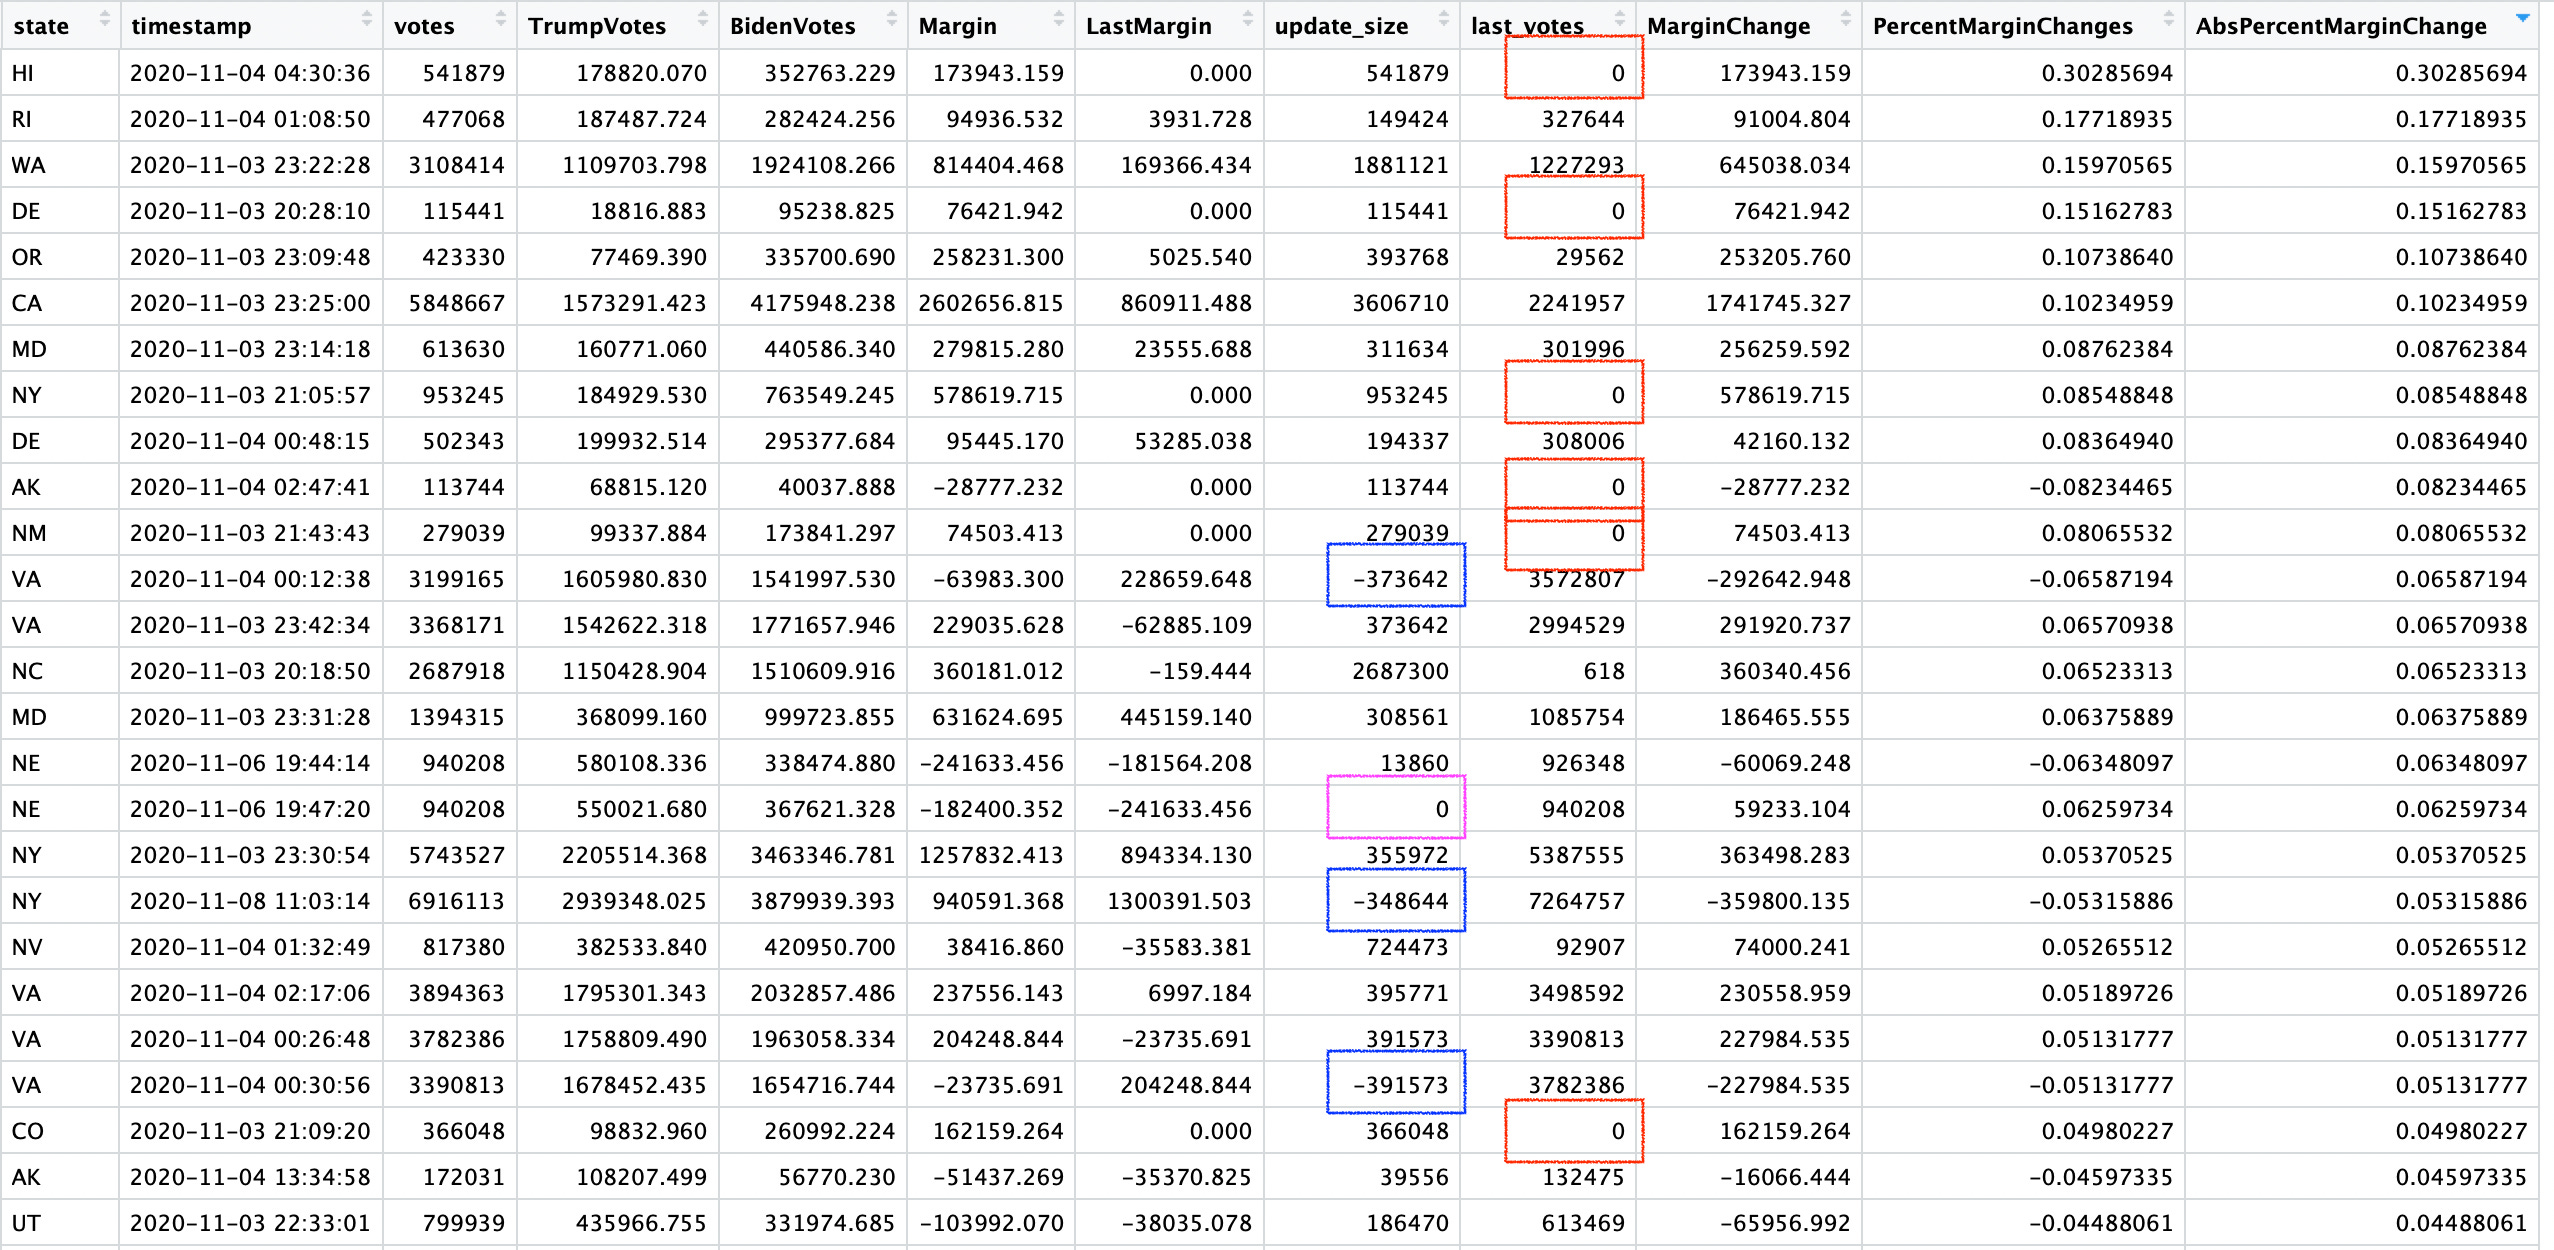
Next step - let’s look at the non-negative updates that caused the largest % swings in margin given the final vote count. I’m going to calculate the difference in margin by subtracting the Trump votes from the Biden votes for each new update, so positive margins will indicate vote tallies that favor Biden and negative, ones that favor Trump for that particular update. I’m going compute margin difference for each new update, by subtracting the last margin difference from the new margin difference. If the margin difference is positive that means a swing in Biden’s direction, negative a swing in Trump’s direction. And finally, I’m going to divide that margin change by the total number of votes cast in that state and take the absolute value, so we can look for the updates with the largest relative margin changes.
FYI - You’ll see fractional votes in the Biden, Trump and margin columns, because the vote calculation is done by multiplying a margin % with only three significant digits by the vote total - the core dataset doesn’t have the actual votes for each candidate.
Here’s the top of the list from largest to smallest. You’ll notice that I haven’t done any filtering yet. 6 entries have 0’s in the last_votes column, in red below. That 0 means that these were the first vote update of the election. We can’t discount these margin changes, because they are real and are likely to come up in states where there was a large early set of returns from either in-person or absentee voting, most likely in states that only have a few counties. Then there is the case of large % margin changes when votes actually disappeared, in green below - how do we treat these ? Is is an update with negative votes a correction for issues in early entries or a standalone entry ? Bottom line is that we really can’t know without the full accounting, so we have to be suspicious of every update.
Then there is the strange case of a large margin change in NE, in a vote update without any change in total votes in magenta below. What happened there, and why didn’t “Voting Integrity” find that one ??
If I push down into the time neighborhood for that strange Nebraska zero vote update, we can see that it did indeed happen, and appears to be some accounting cleanup where some 3000 votes or so are shifted from Trump to Biden.

One last important note - these entries represent huge changes in margin due a single vote update. But only 1 out of the 26 occurred in a “contested “ state. And none of these top 26 margin changers is in “Voting Integrity’s” list of possible fraud offenders. The first large margin change updates in WI or MI only shows up once we get to #42 in the list.
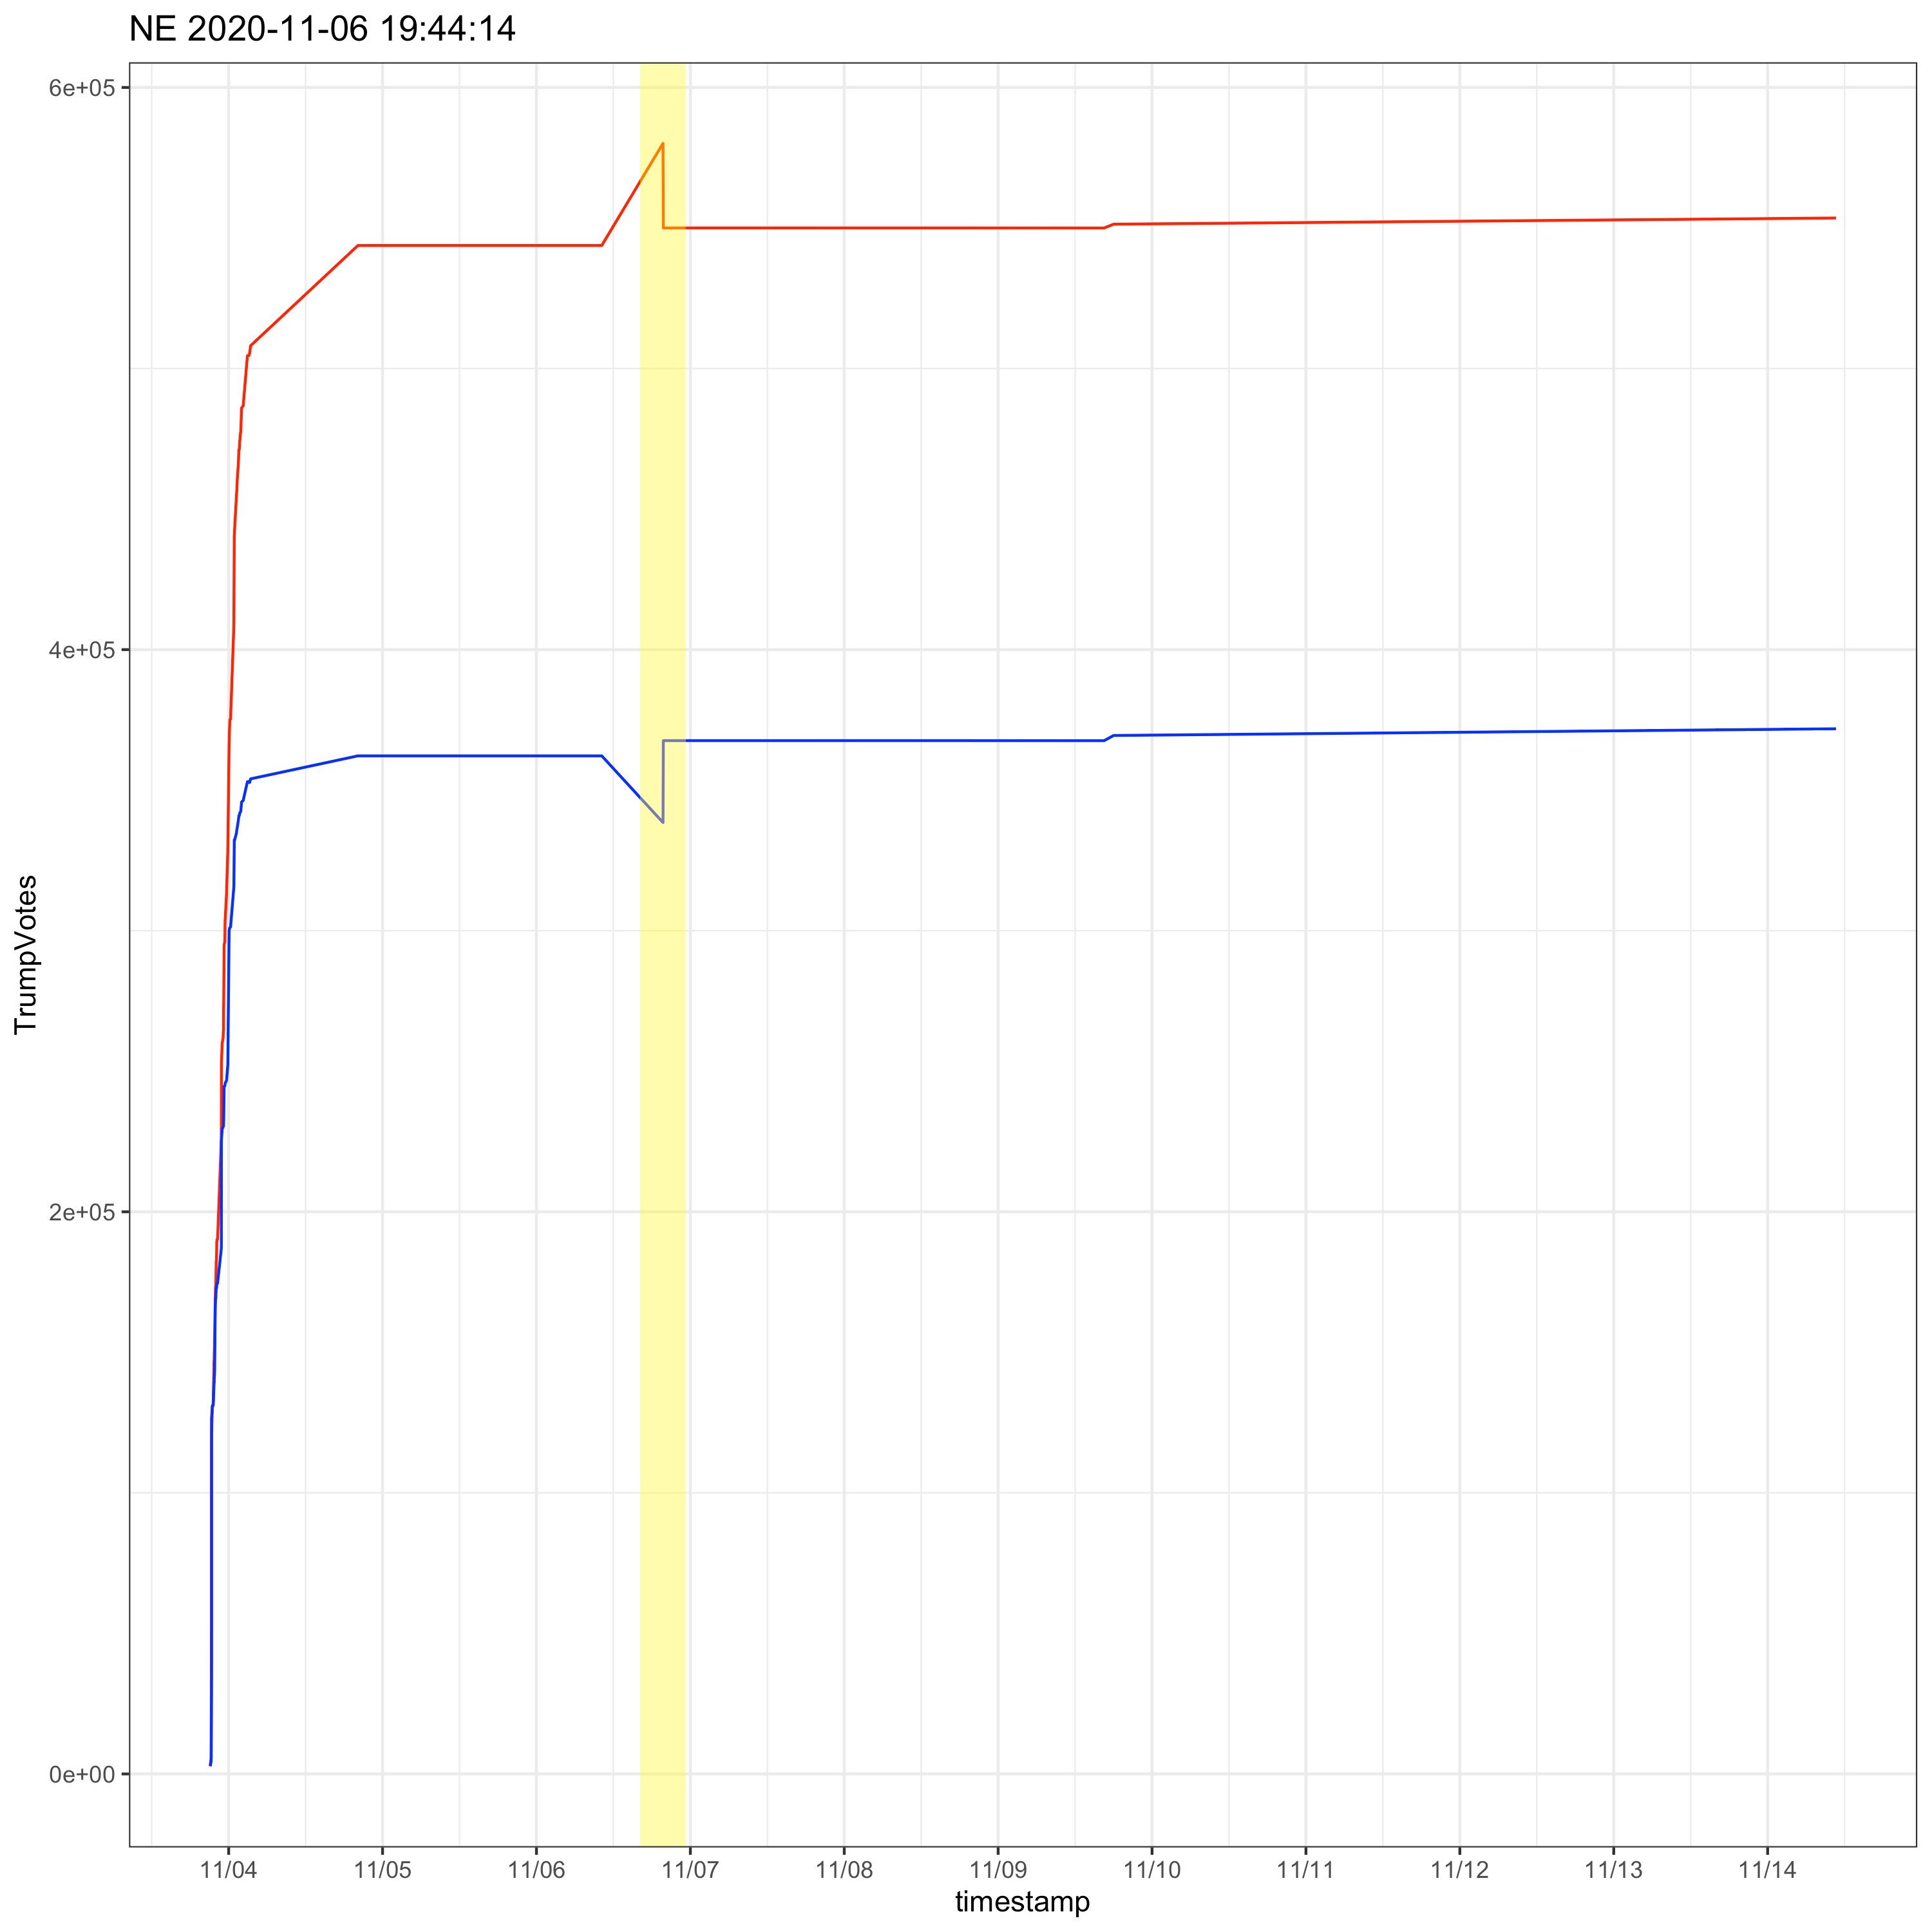
Next, I’m going remove all three of the types of large margin change updates I highlighted above - ones at the very start of the vote count, and vote losses and zero change updates that seem to be “accounting” adjustments. Once I remove them, I get a different top 25.
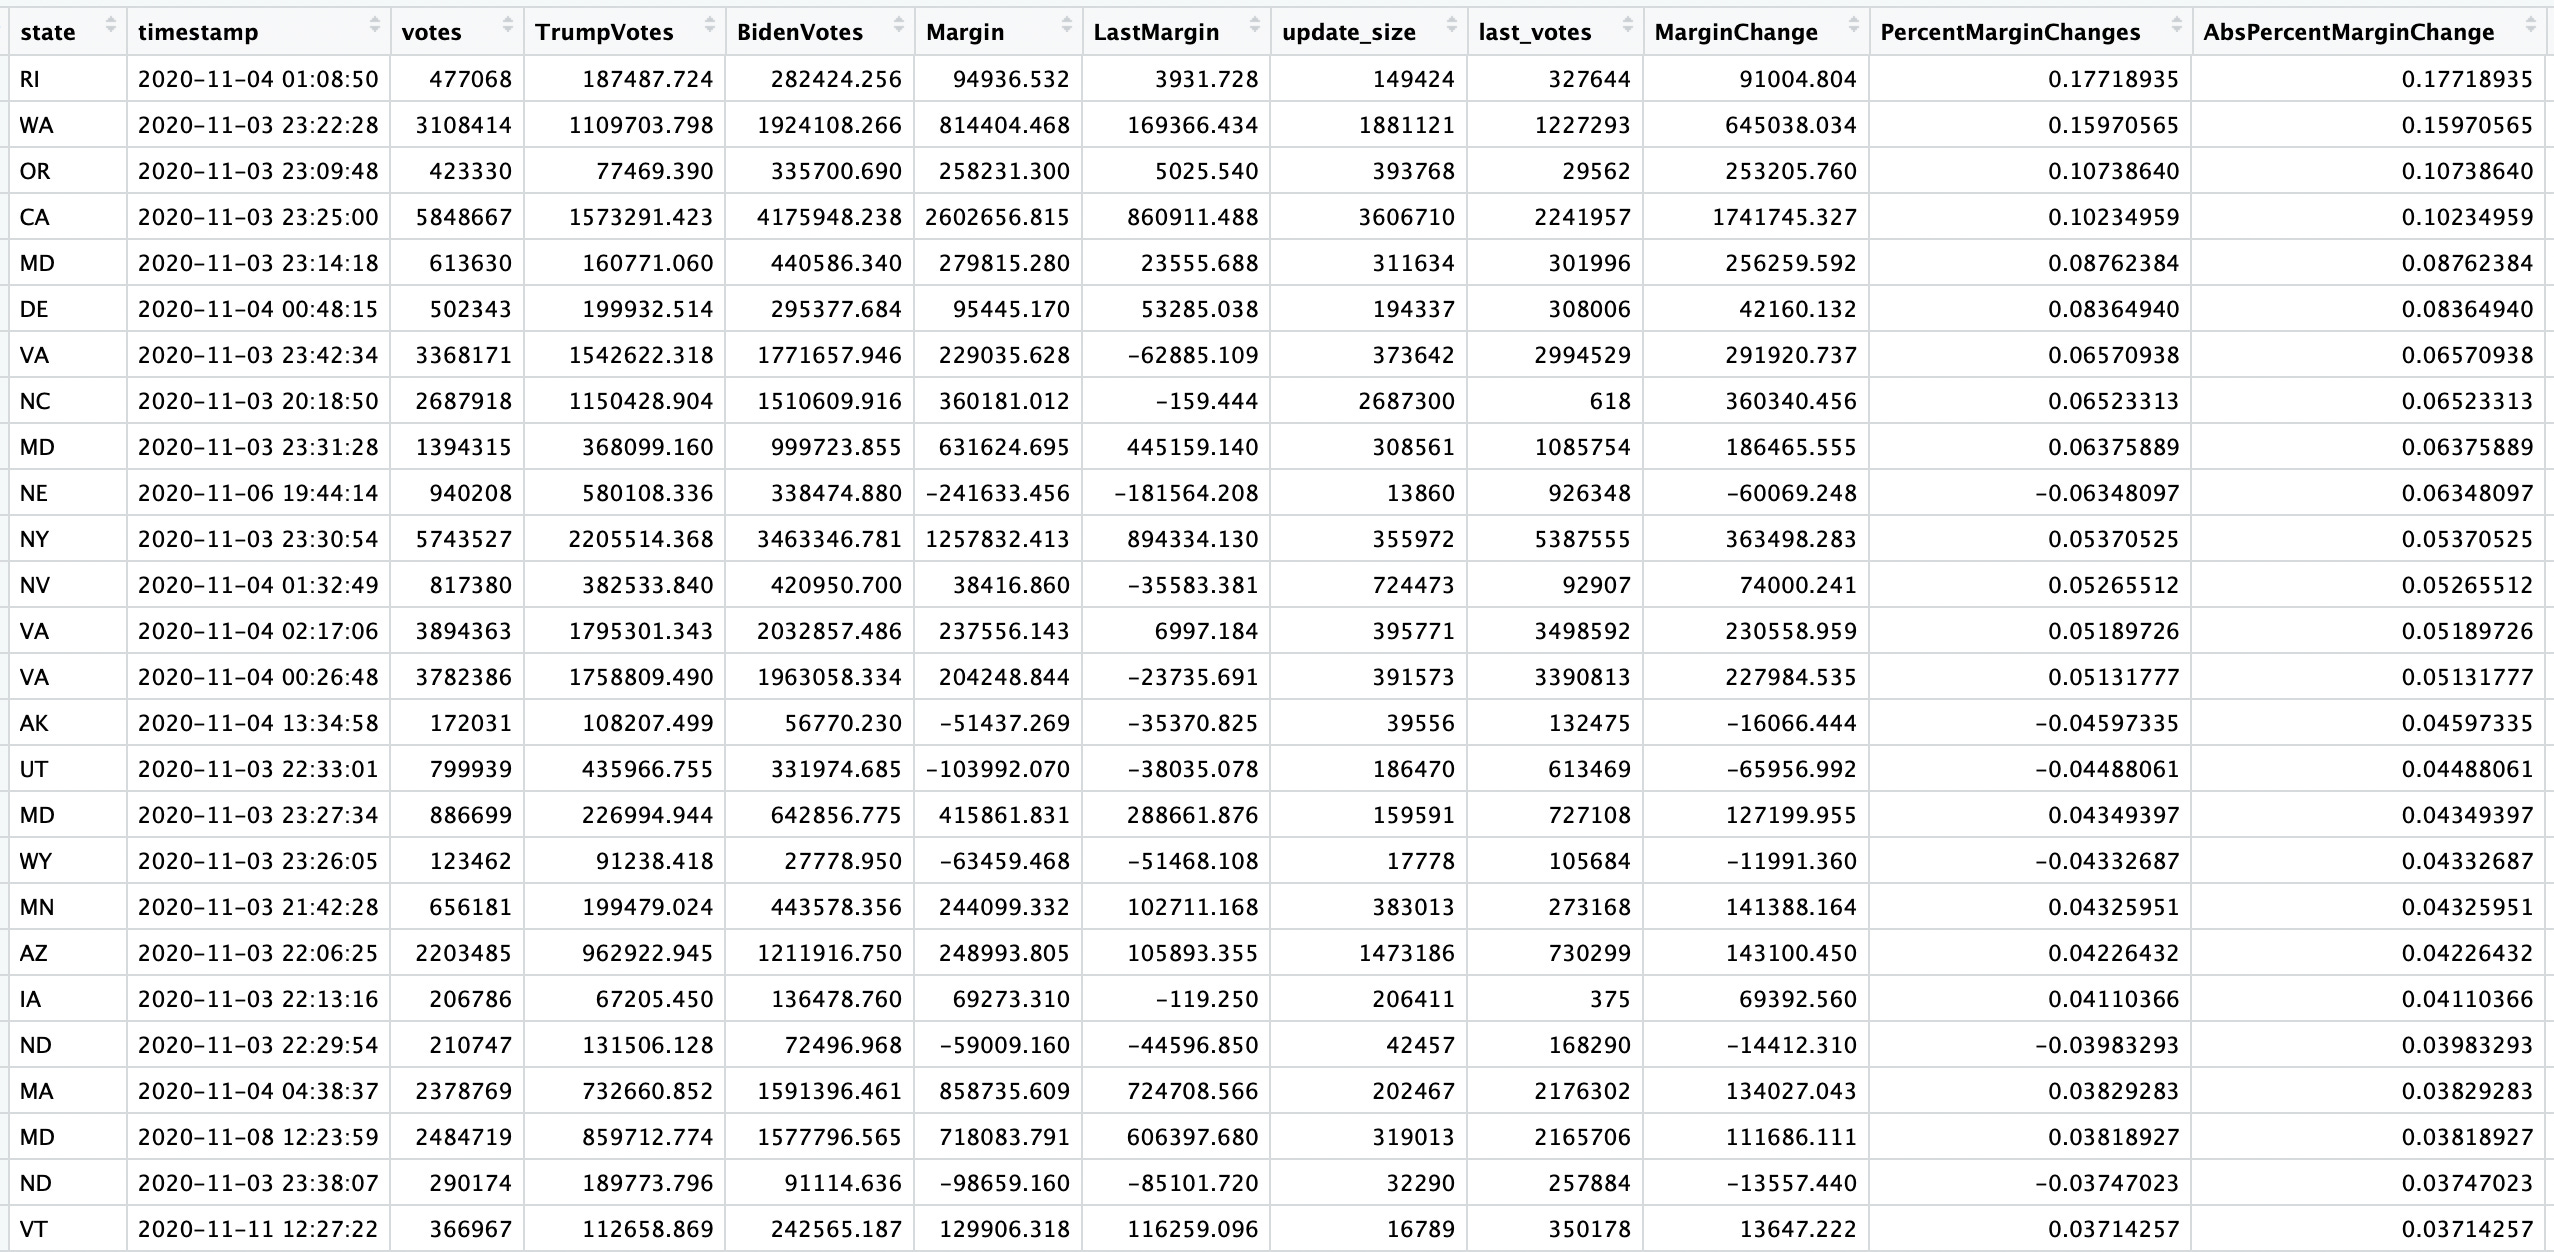
If I chart the largest remaining vote margin change update, in RI, I see that it happens very close to the start of vote tabulation, though not right at the very beginning. It’s an update with a major differential favoring Biden.
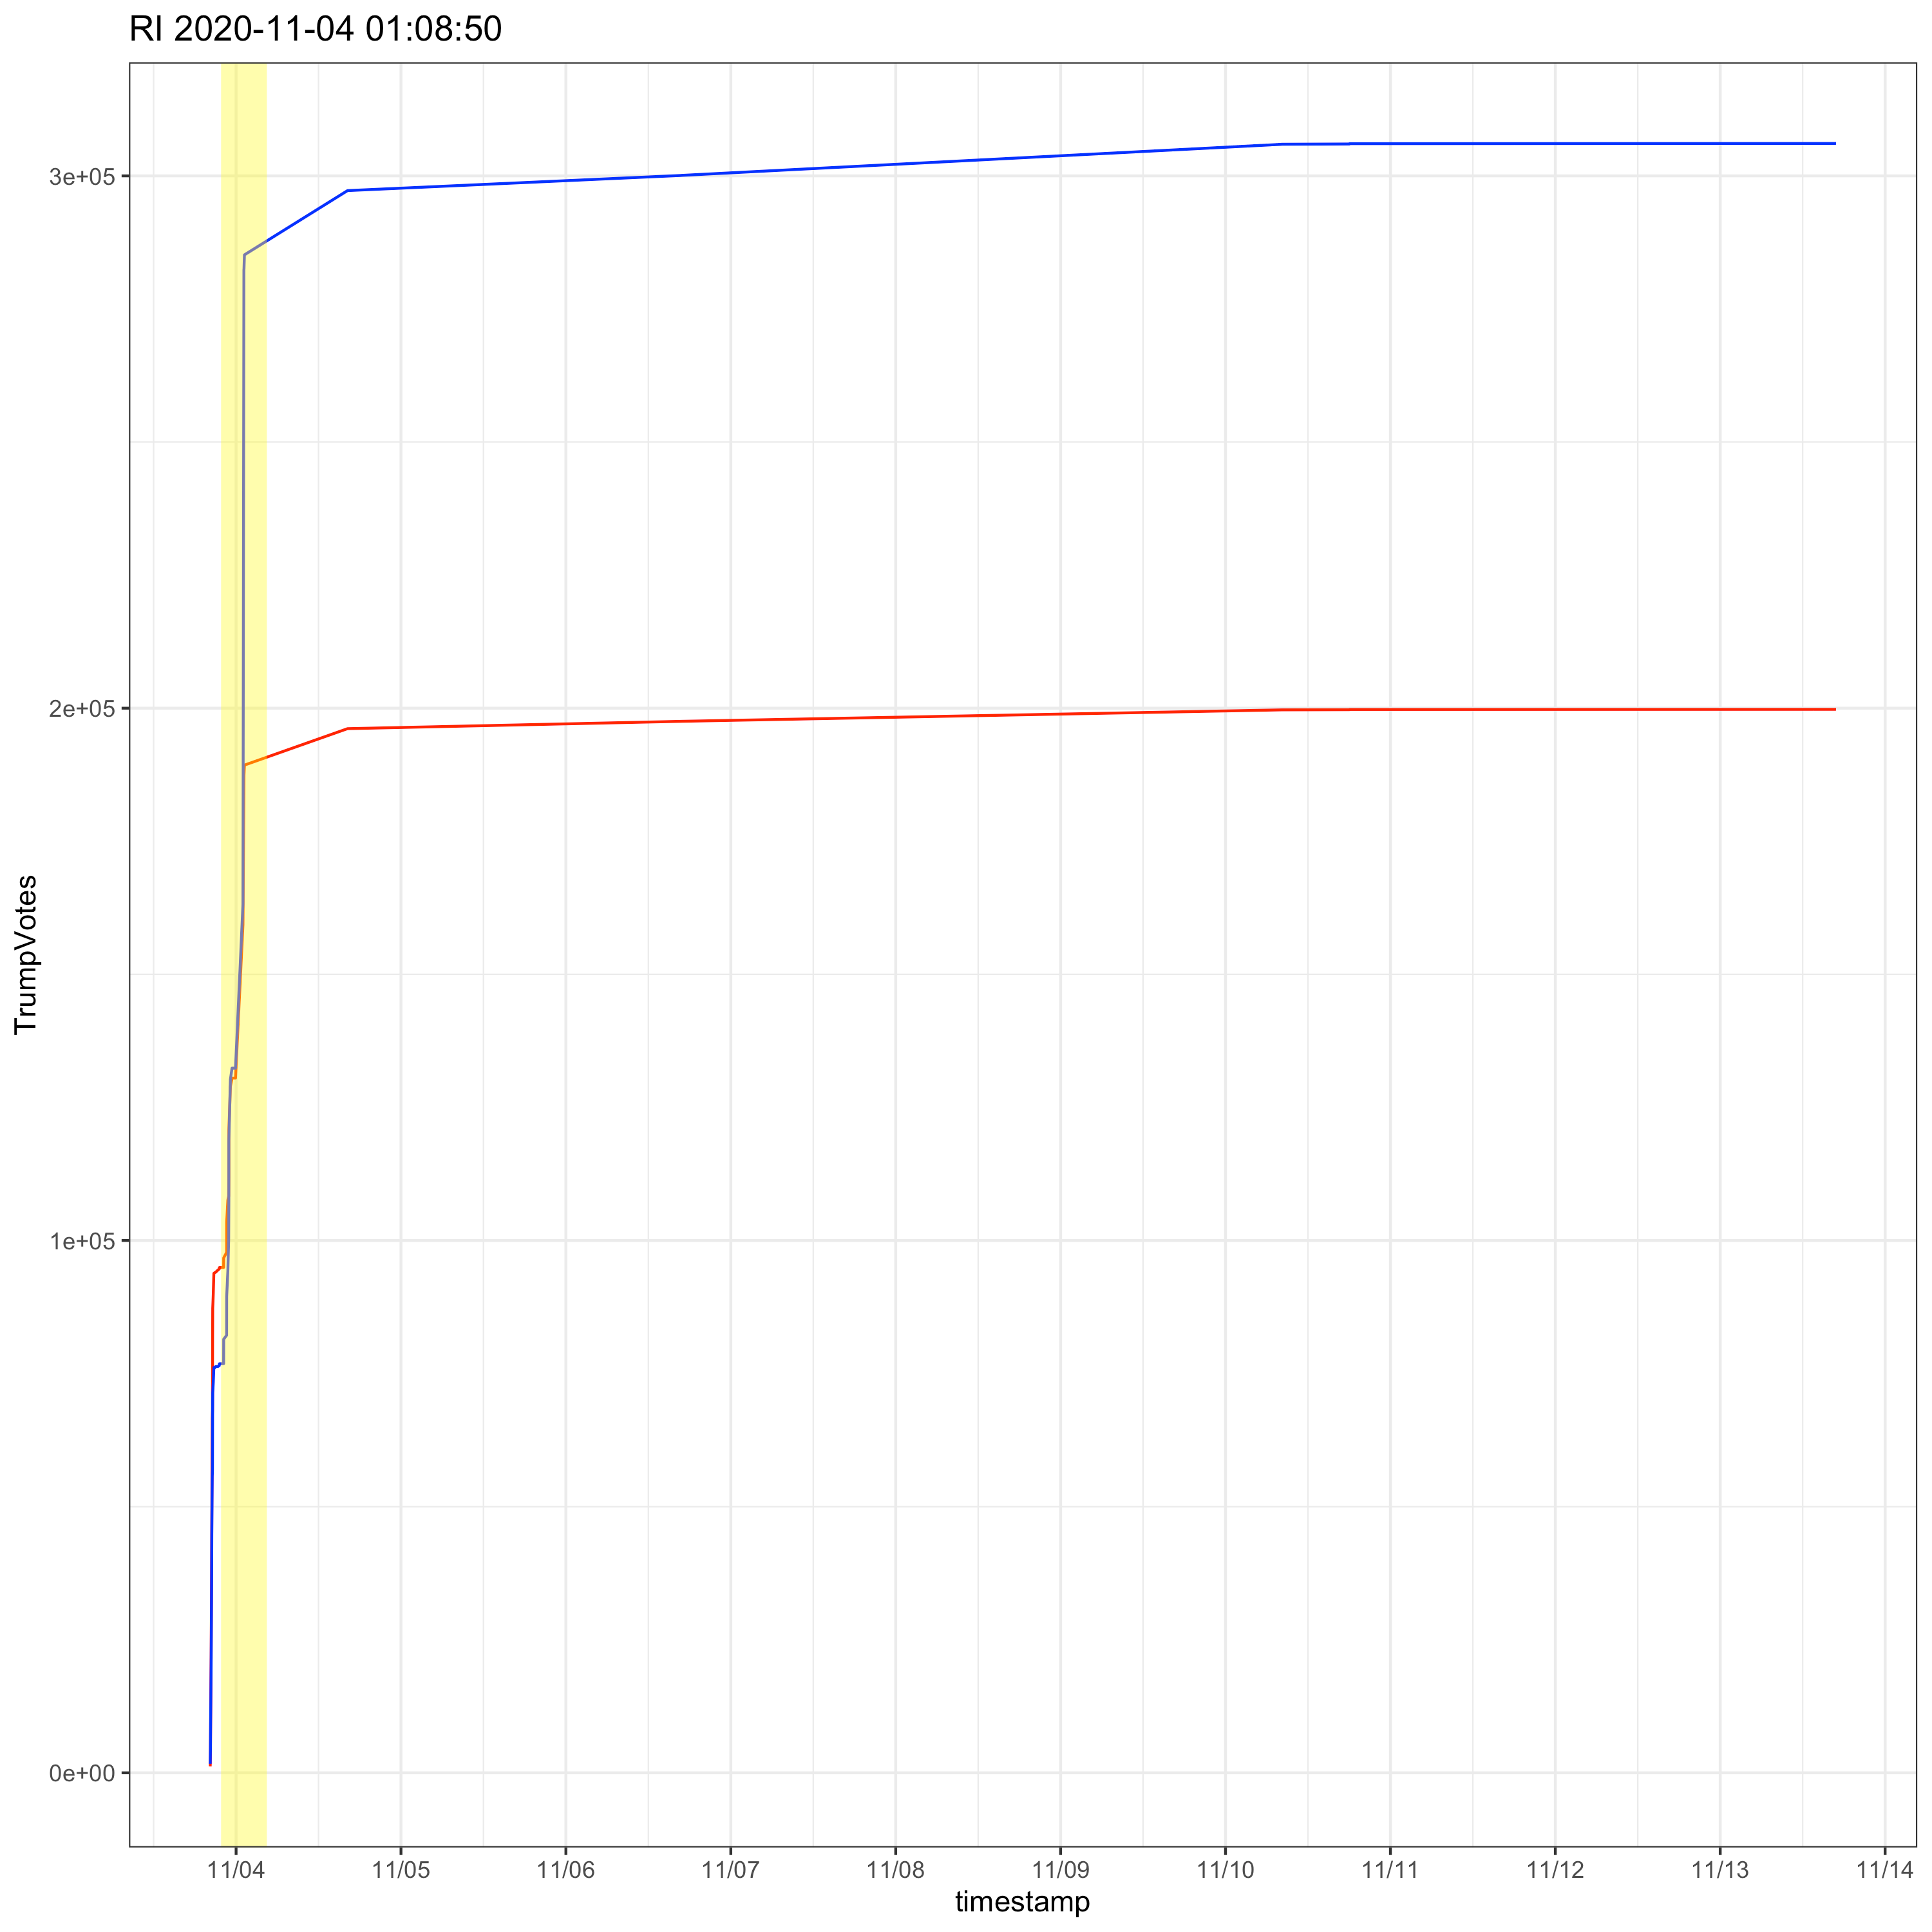
Going to the next largest update margin, in WA, it’s the same. Another vote update close to the start of tabulation, but not at the very beginning. I have to go through another 7 before I hit one where the update happens well into tabulation. So, there are quite a few big margin changing updates, much larger than the ones in WI and MI, right at the start of vote tabulation that “Voting Integrity” missed.
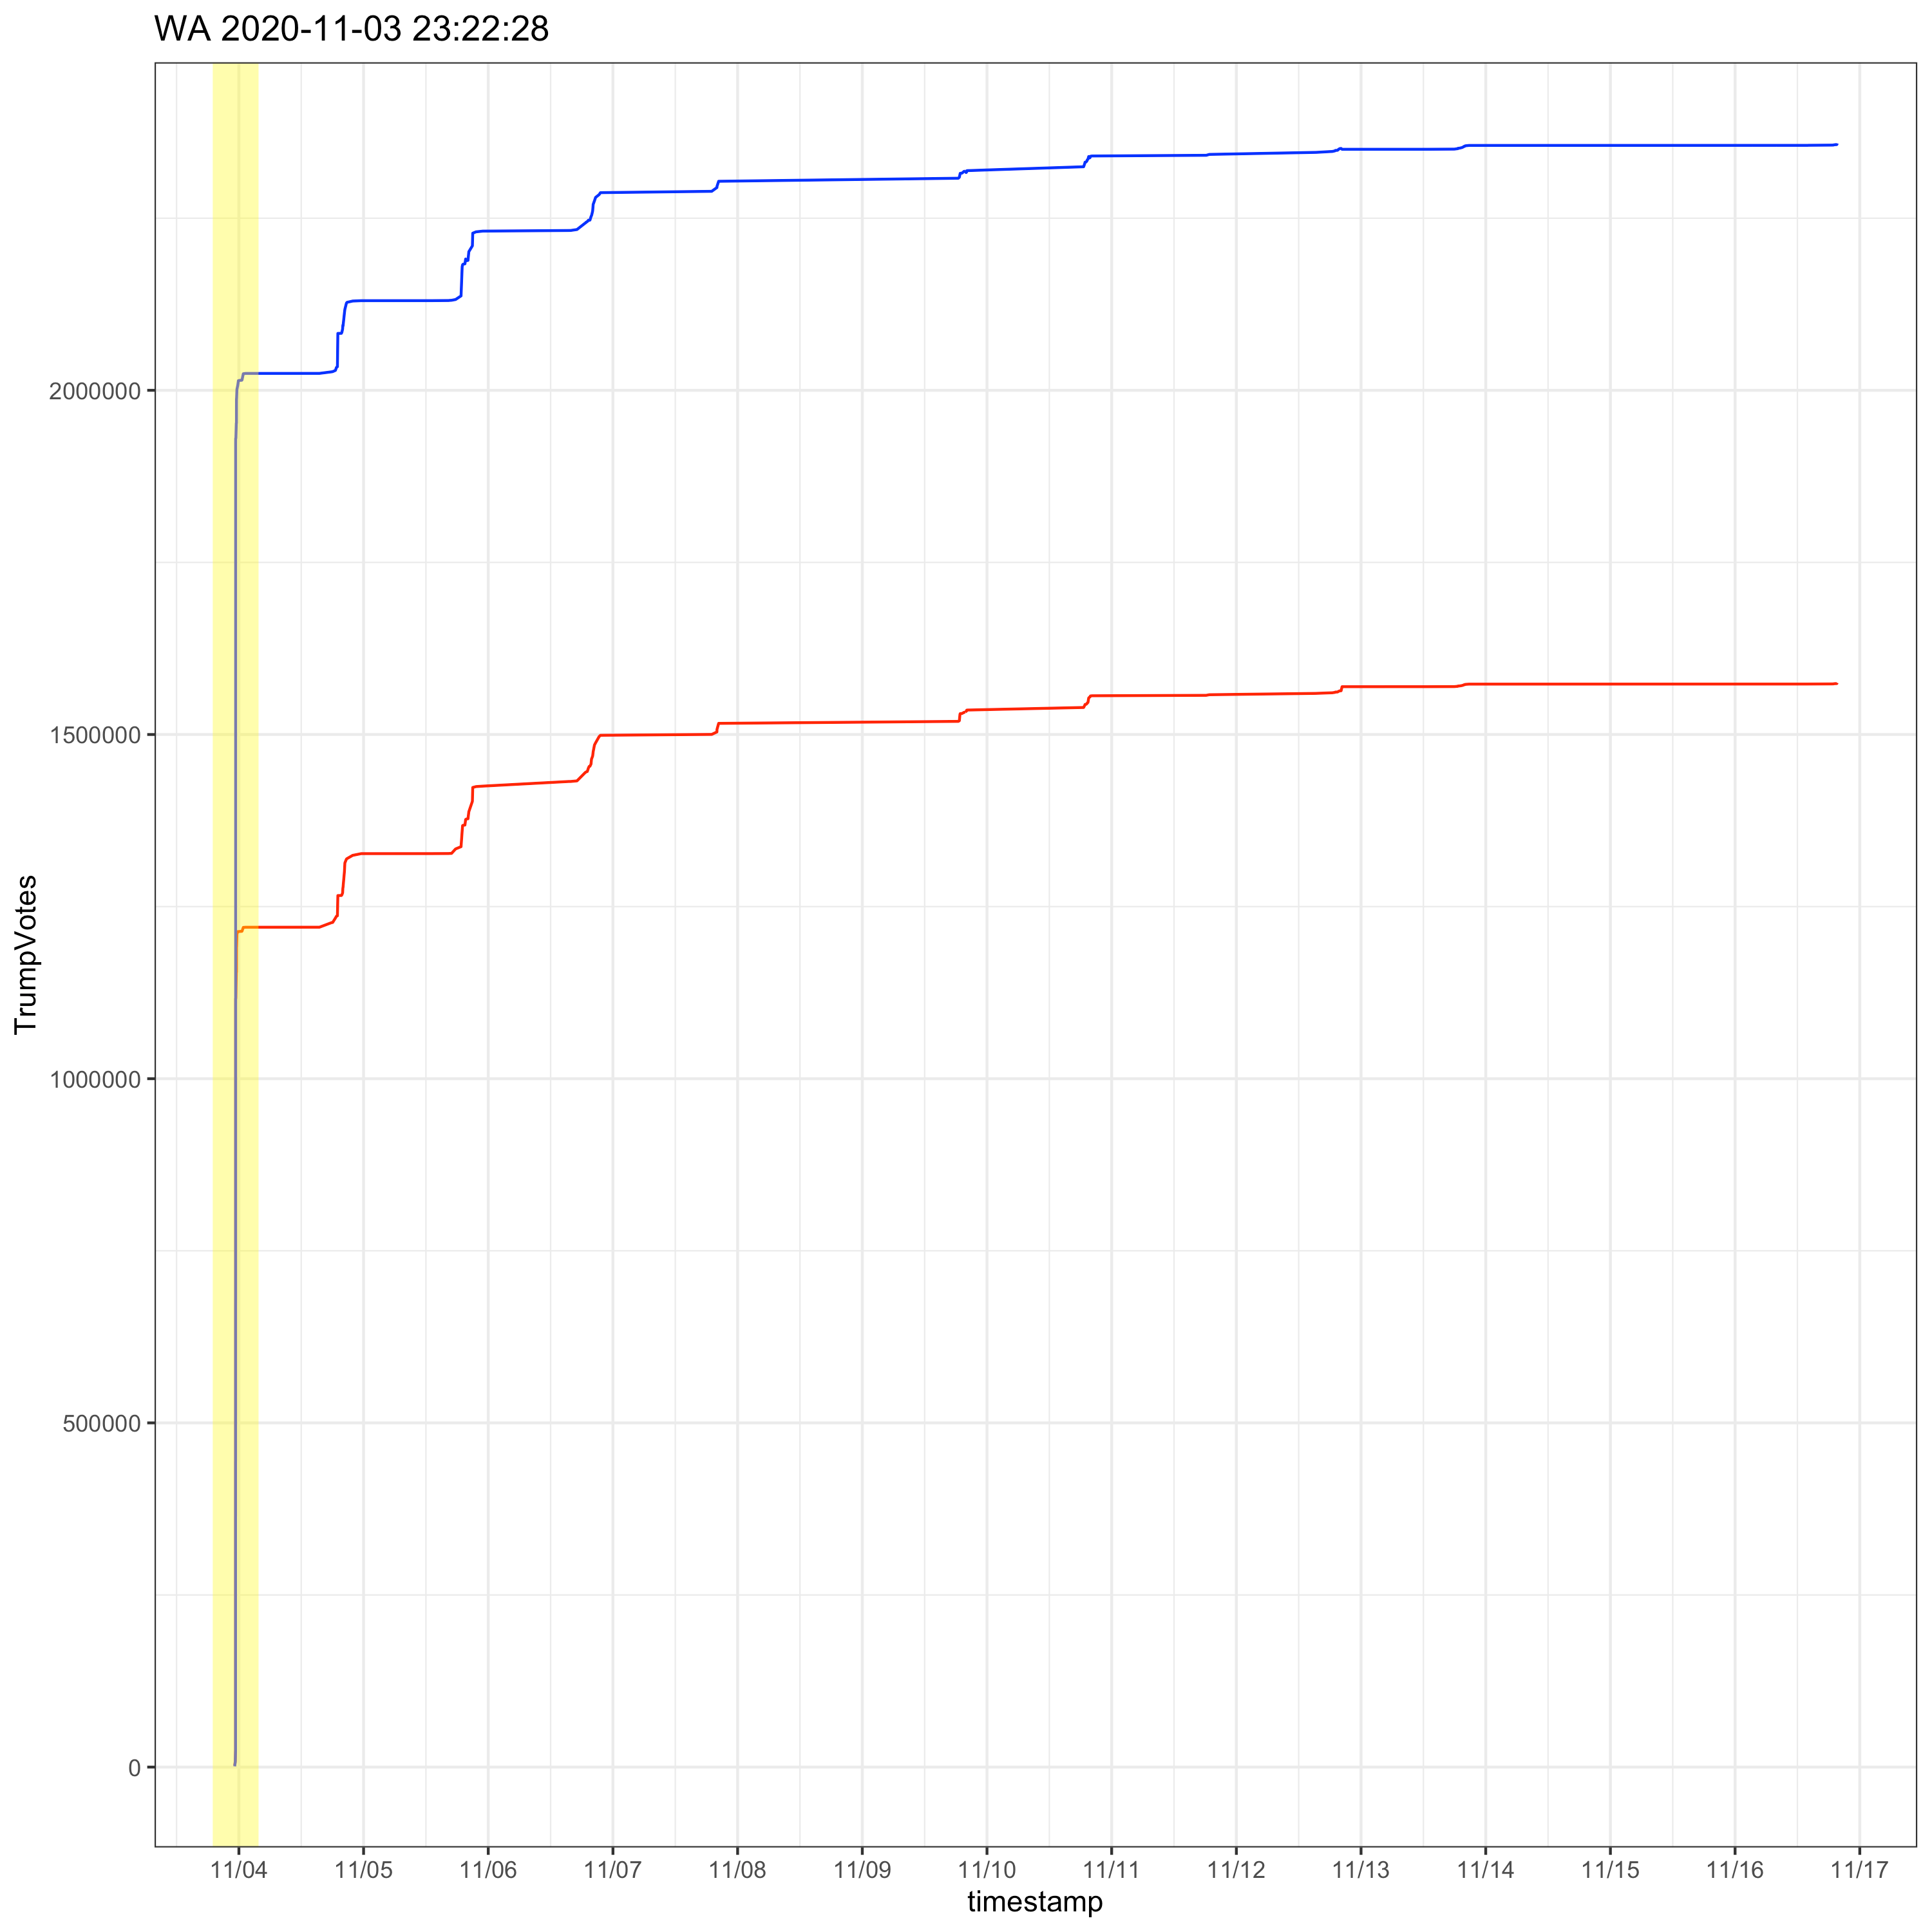
Here’e the first big margin changing block that occurs well into the tabulation process in Nebraska. I’m not sure what to make of it. It’s an update of 13,860 votes, but changes the margin by -60,069. Looks like someone is stealing votes from Biden and giving them to Trump, but then they restore things quickly with the next update.
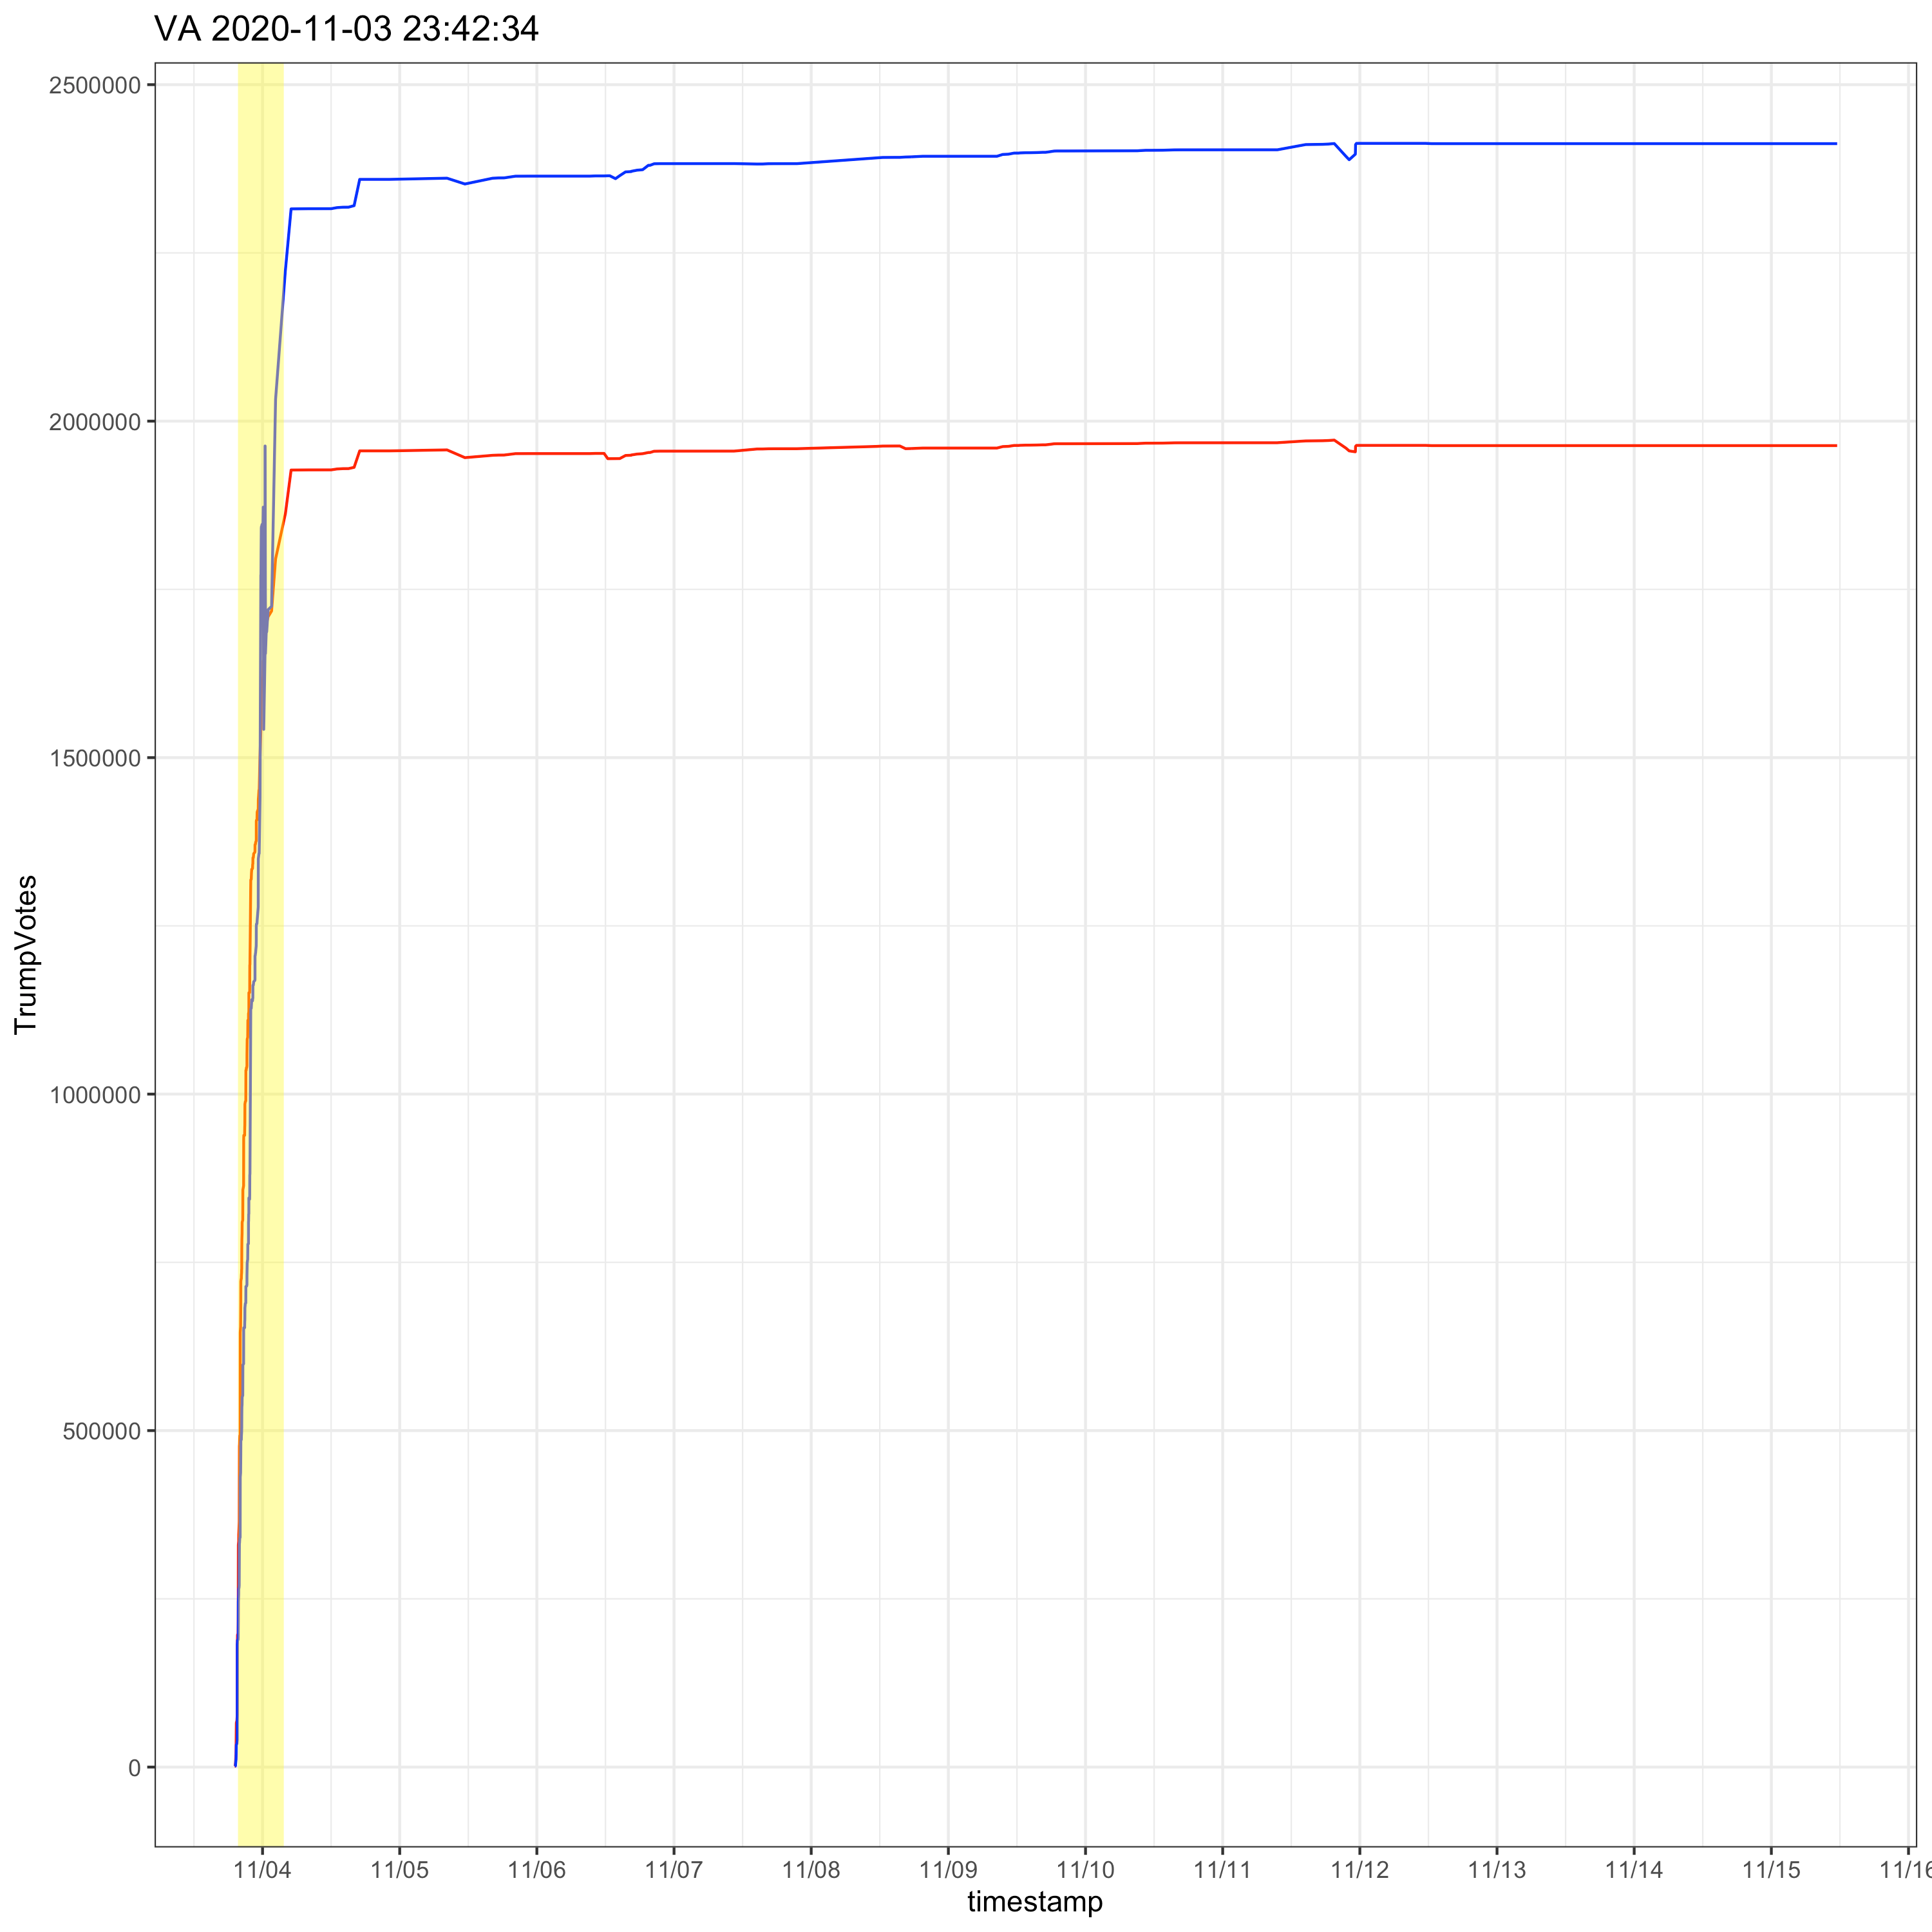
I ignored VA the first time I looked at the graph because it looks like a simple of case of the biggest margin changes occurring in the first few hours of tabulation, but it turns out there were 3 huge margin changes within 4 hours of one another. Really ugly stuff could be hiding in those few hours.
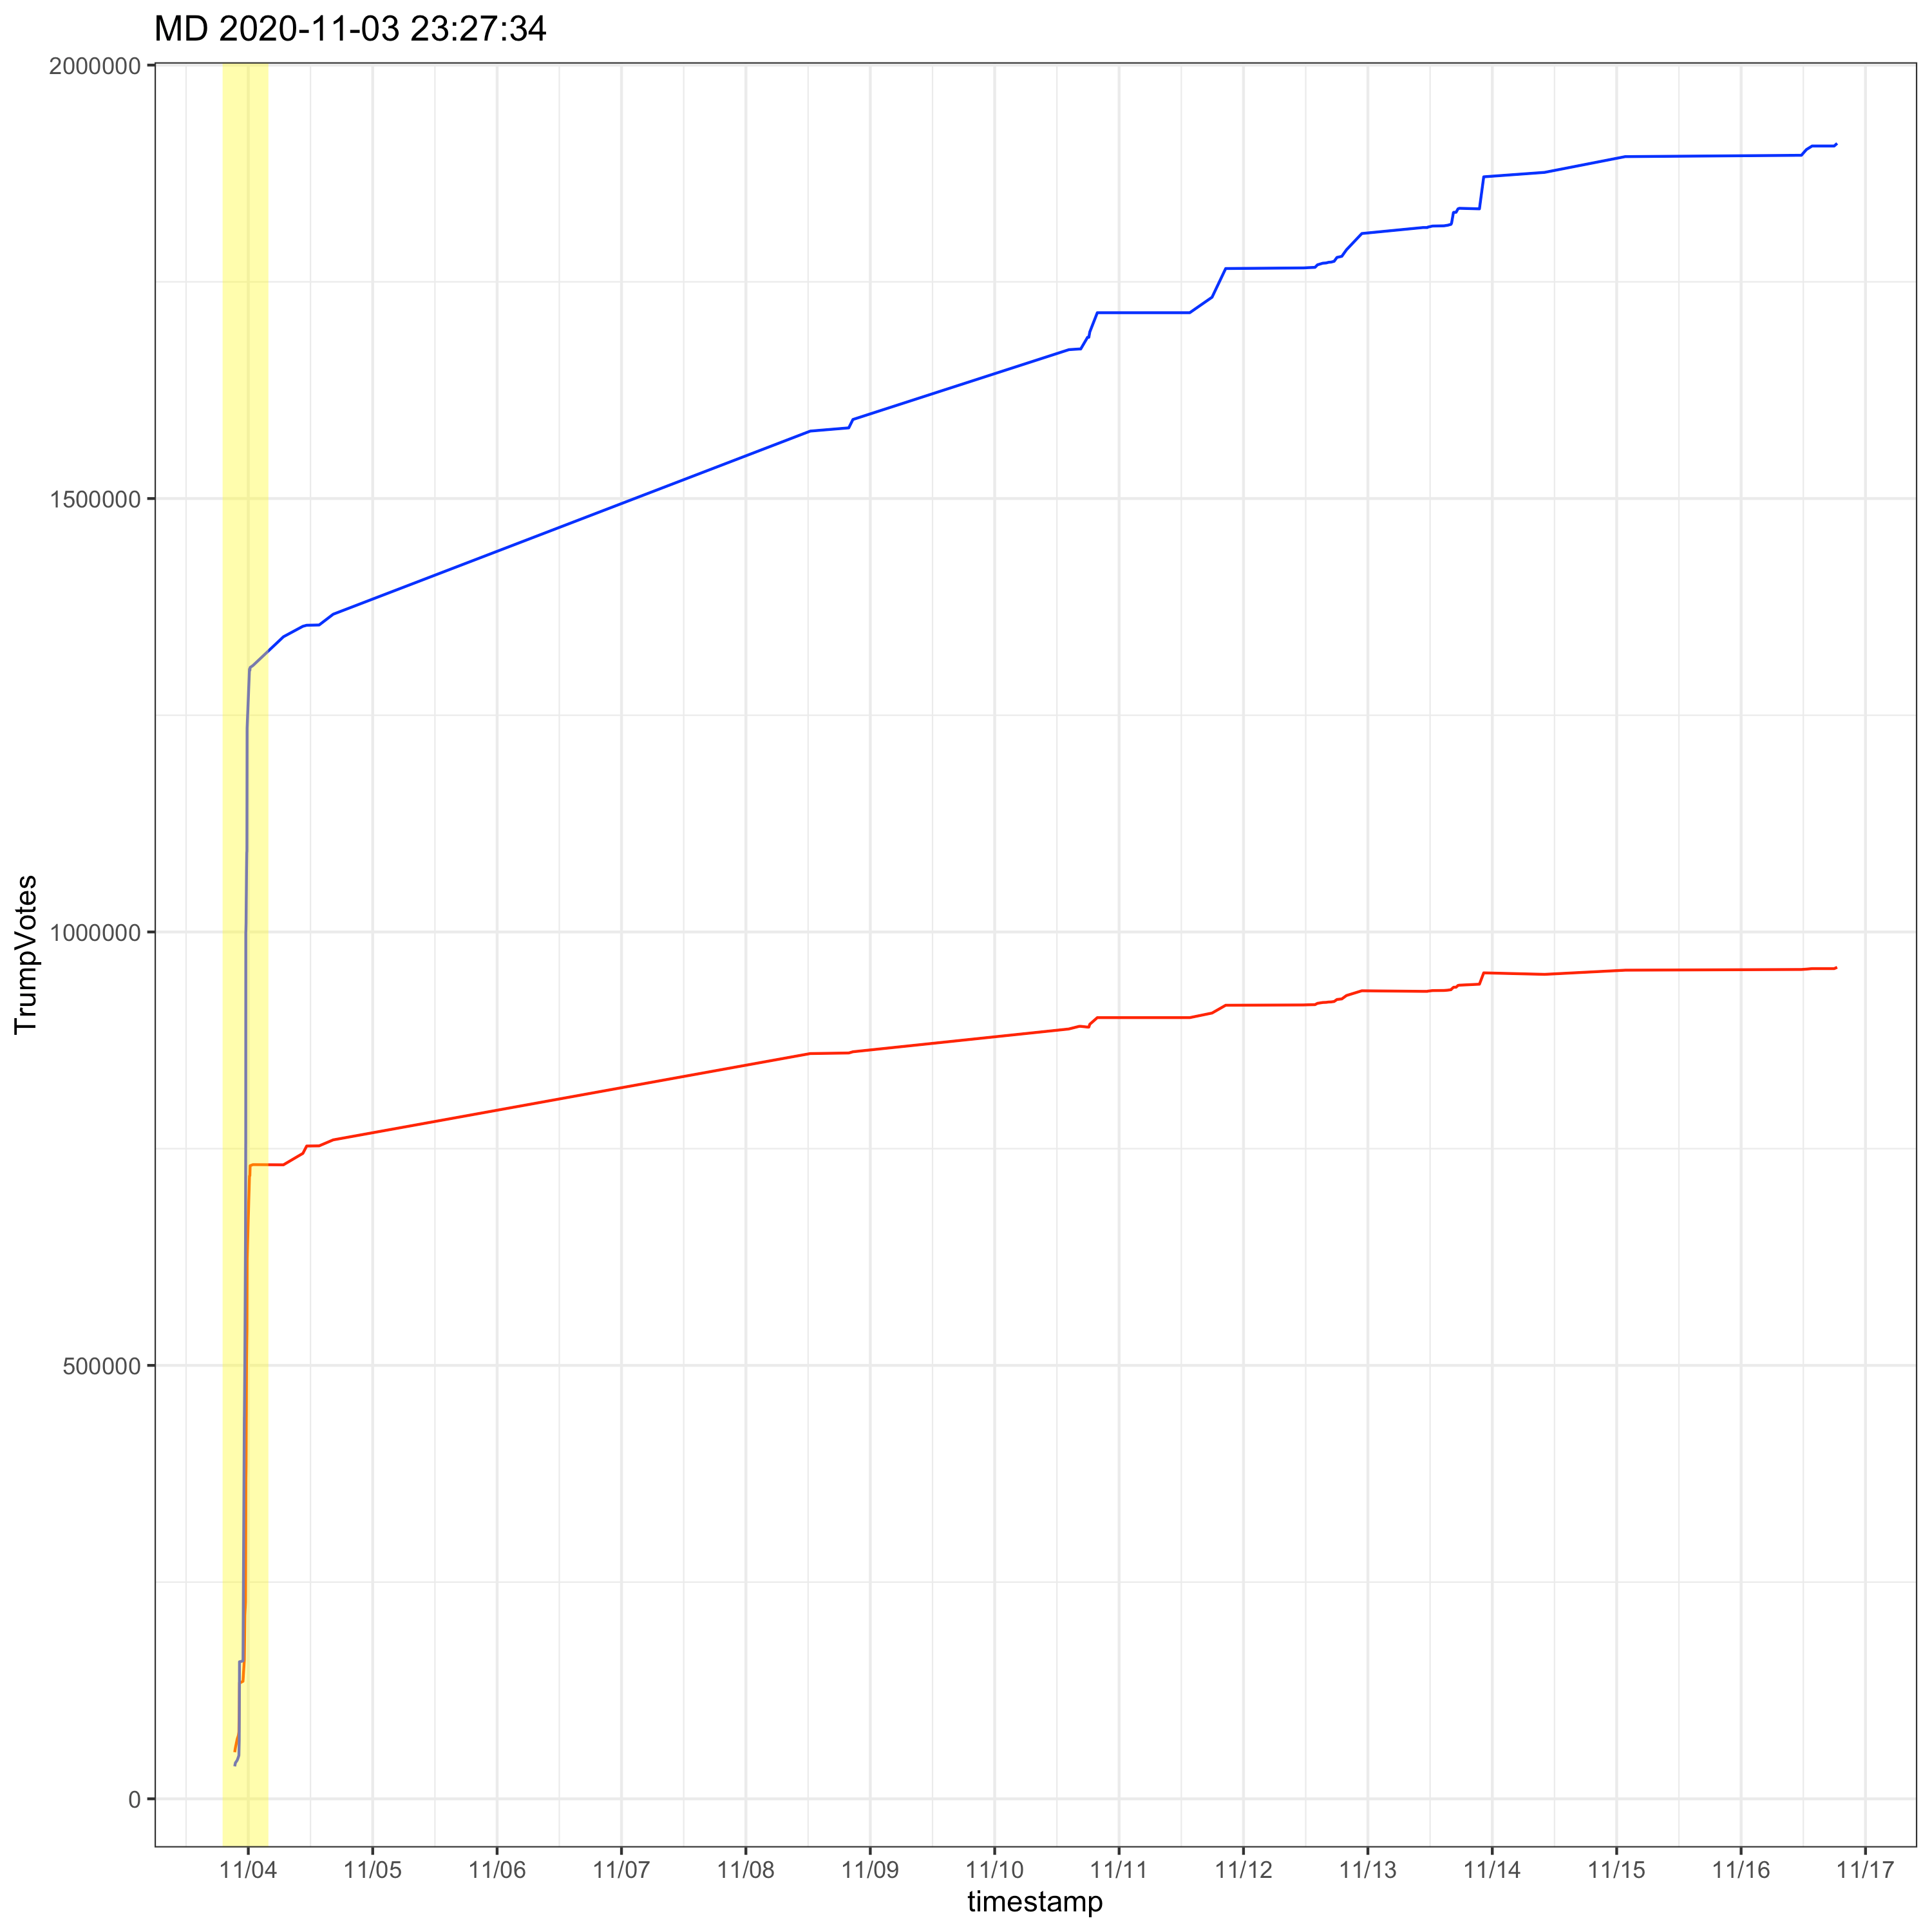
And the start of tabulation in MD also hides 3 changes in margin that are far larger than anything in WI or MI, similar to VA.
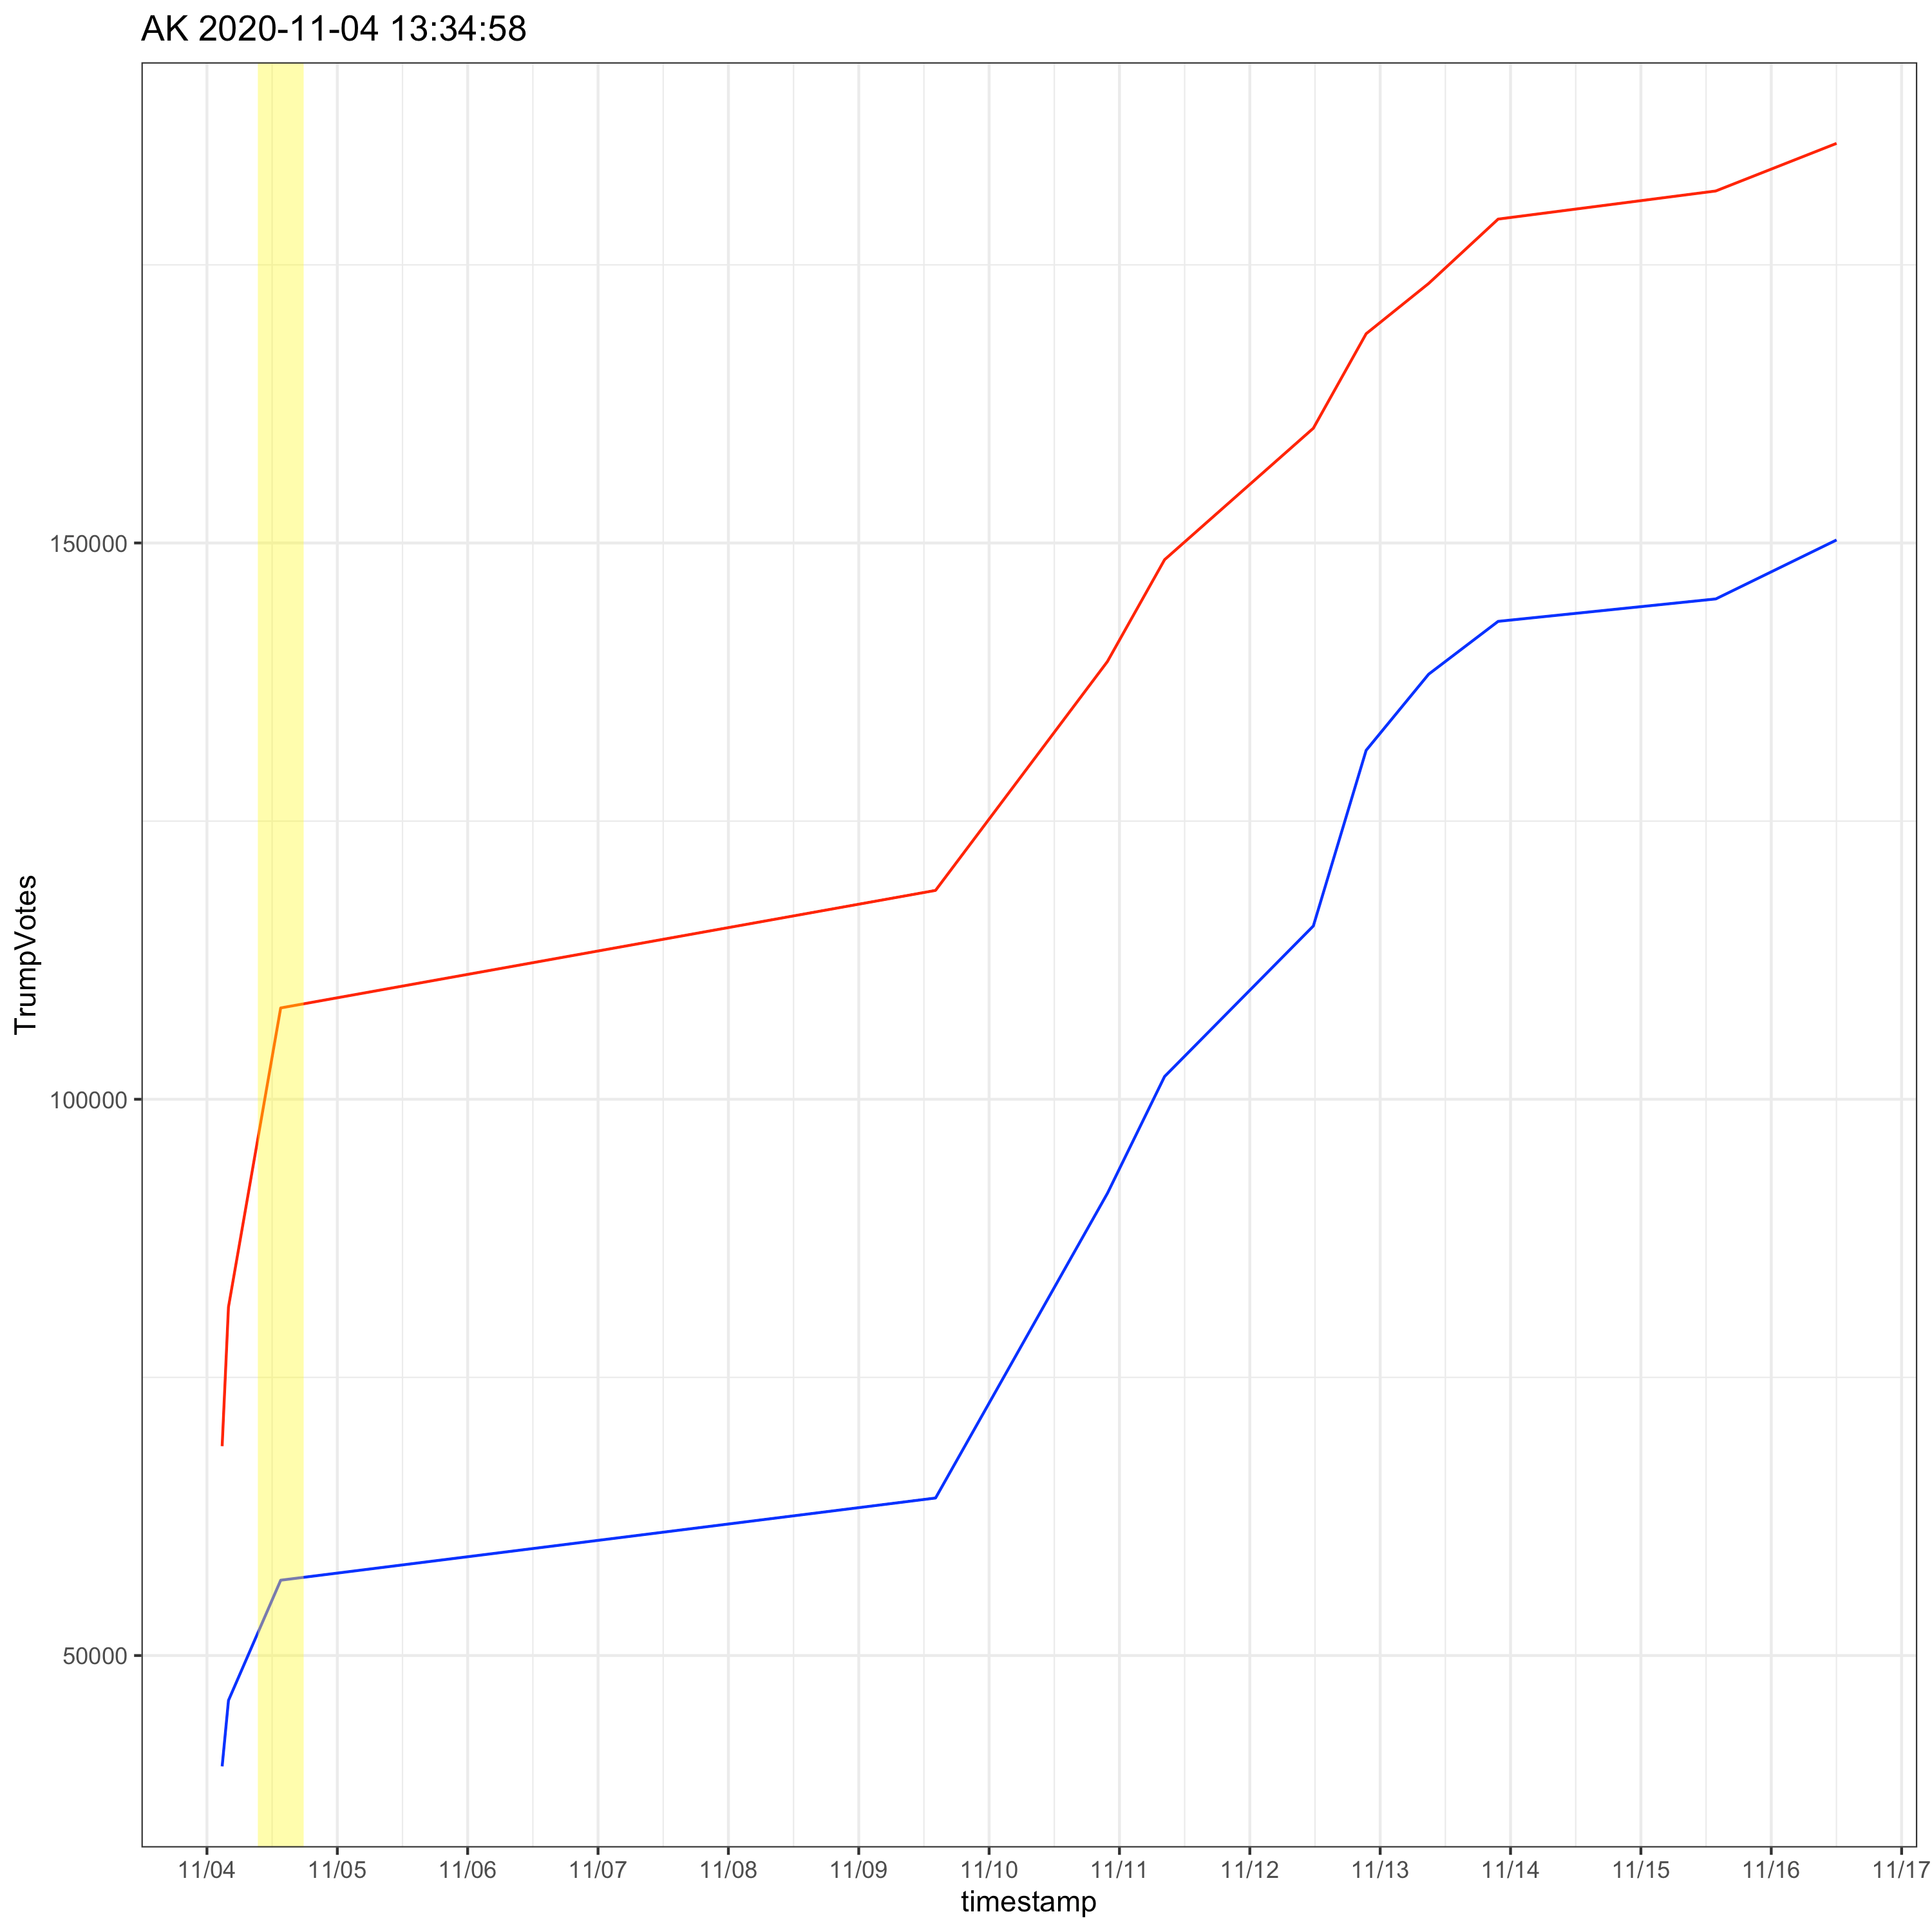
Alaska is a little special because they only did a very small number of updates spread out over many days due to the geographic challenges of tabulating votes across their unique election district (ED) structure. But even without the fast changes in the early hours of tabulation, they had at least one large margin change update.
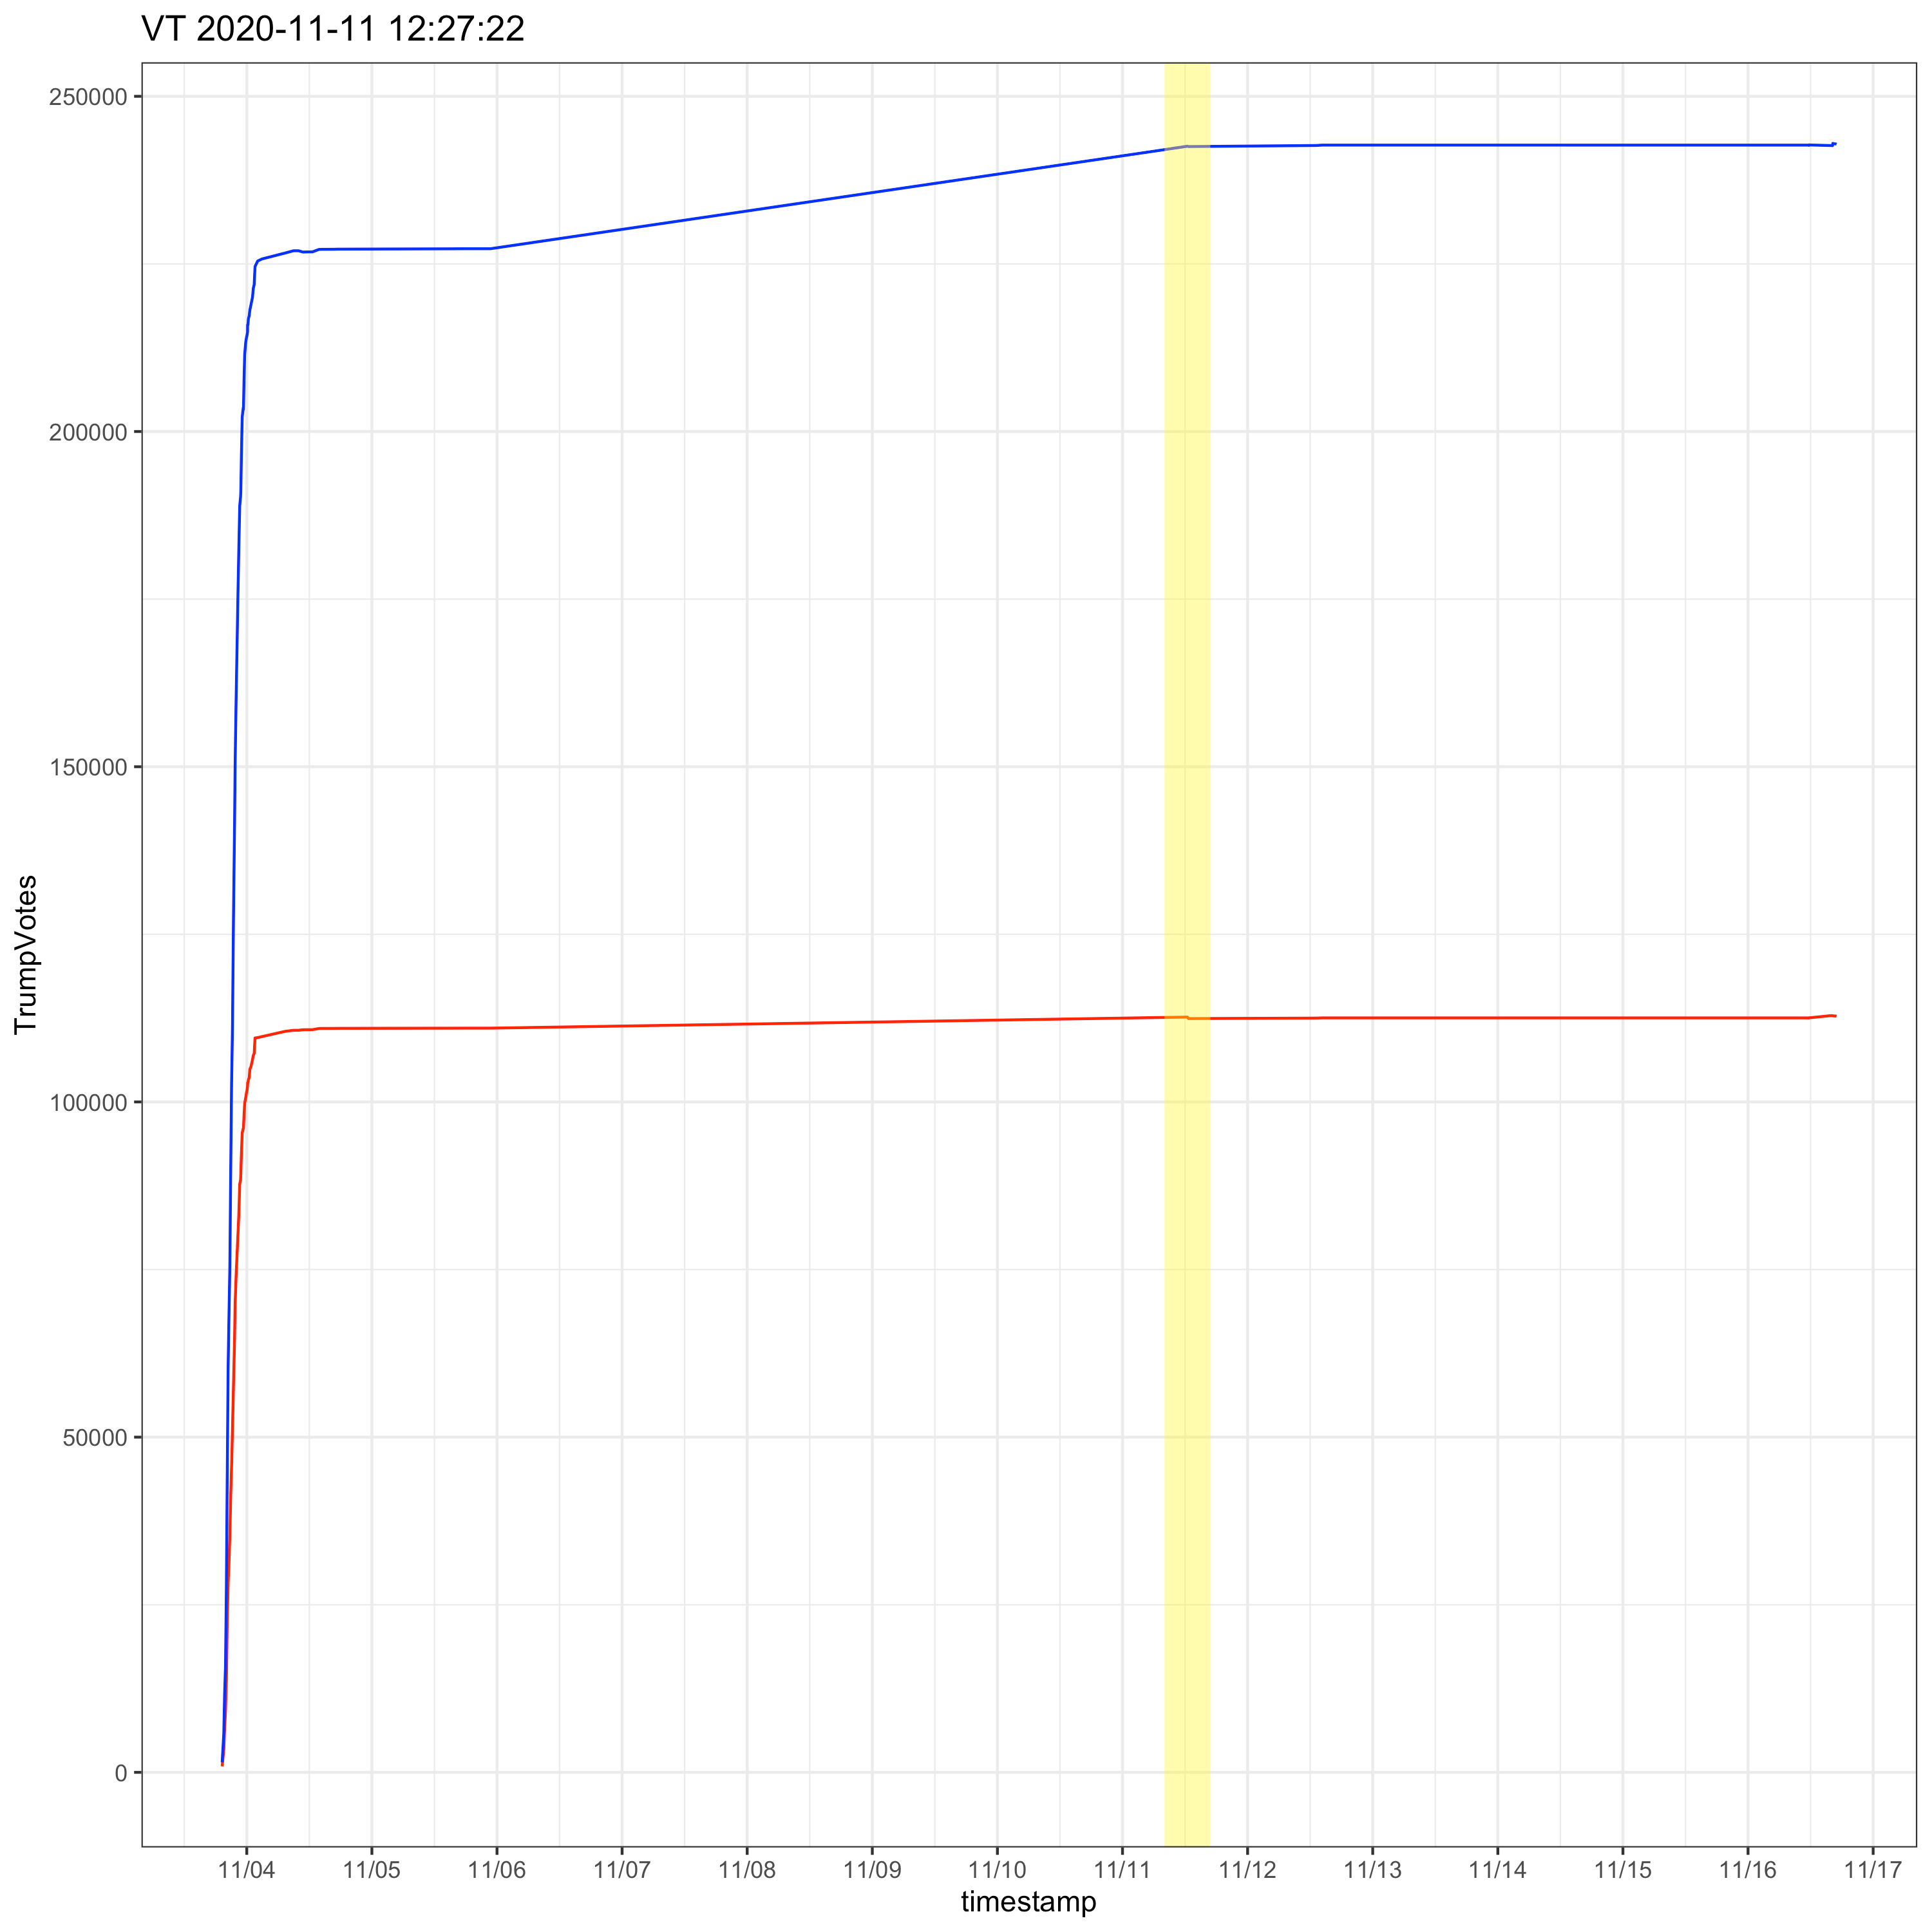
Surprisingly, largest margin change #26, VT, looks suspicious. There’s a large change in margin from a vote update 8 days into the process. How did “Voting Integrity” miss this one ?? An update of about 17K votes, that changed the margin by about 13K.
Two places further down the list, we get to WI, the first place “Voting Integrity” chose to look closely at. Looking at “Voting Integrity’s” prime suspect vote update, it looks very little different that most of the previous 27 largest margin changes. It occurs early in the vote count, while votes are coming in fast and furiously. The only thing that distinguishes it is that it, along with a couple more updates puts and keeps Biden over the top. So if “Voting Integrity” were truly looking at a full set of vote margins anomalies, they should have looked at 27 or more ahead of this one in WI. And comparisons of the update would have shown that it was fairly similar to the 25 or so larger margin updates in this list.
Thanks for the response Vote Integrity,
I'm a data scientist and absolutely agree that data cleaning is a big part fo the job and is not on it's own suspicious. But data cleaning and the decisions to apply filters to search for final are subjective. Remove some data noise, but not all of it, then calling likely remnants noise a signal of fraud, is the mark of a biased investigation. It's pretty clear that you were selective and subjective in your data cleaning and filtering to find the "pattern mismatches" you claim.
I'm going to continue to respectfully question your work and intentions, because I'm seeing far larger anomalies that you should have been noting if your goal was really to find problematic voting patterns. My hypothesis is that you "cleaned" many of the messy updates, choosing to keep and focus on a few smaller remnant "dirty" points in the data in a few contested states to identify your pattern. More as I peel back the data in my spare time...
(Copied from your comment on https://votepatternanalysis.substack.com/p/voting-anomalies-2020)
Hi David,
Regarding the vote updates which have the totals dropping to zero, we removed those *before* computing successive vote differences. These are almost certainly either data errors themselves or reflect a bizarre way of issuing corrections. Data-cleaning is a very common and normal part of data analysis and shouldn't be regarded as suspicious. The appendix linked to in this report provides the entirety of the code and data used for this report and you can see exactly what we did if you look there.
On your second point, there are of course other ways to look at the data -- infinitely many of them, in fact. We chose to do it this way because we thought it was the best formalization of a "vote spike" which many online had noticed and which were the motivation for this investigation (and report). While measuring the significance of any particular vote update to the final outcome is interesting, it wasn't the goal here.
Best,
Vote Integrity
One more thing worth noting here is that there has been a great deal of suspicion, and understandably so, around vote updates which involve vote counts for any candidate dropping. Assessing the legitimacy of these is inherently difficult with a data set which is only state-level and was out of scope for our investigation, but we wish you the best in your work.